Fig. 3
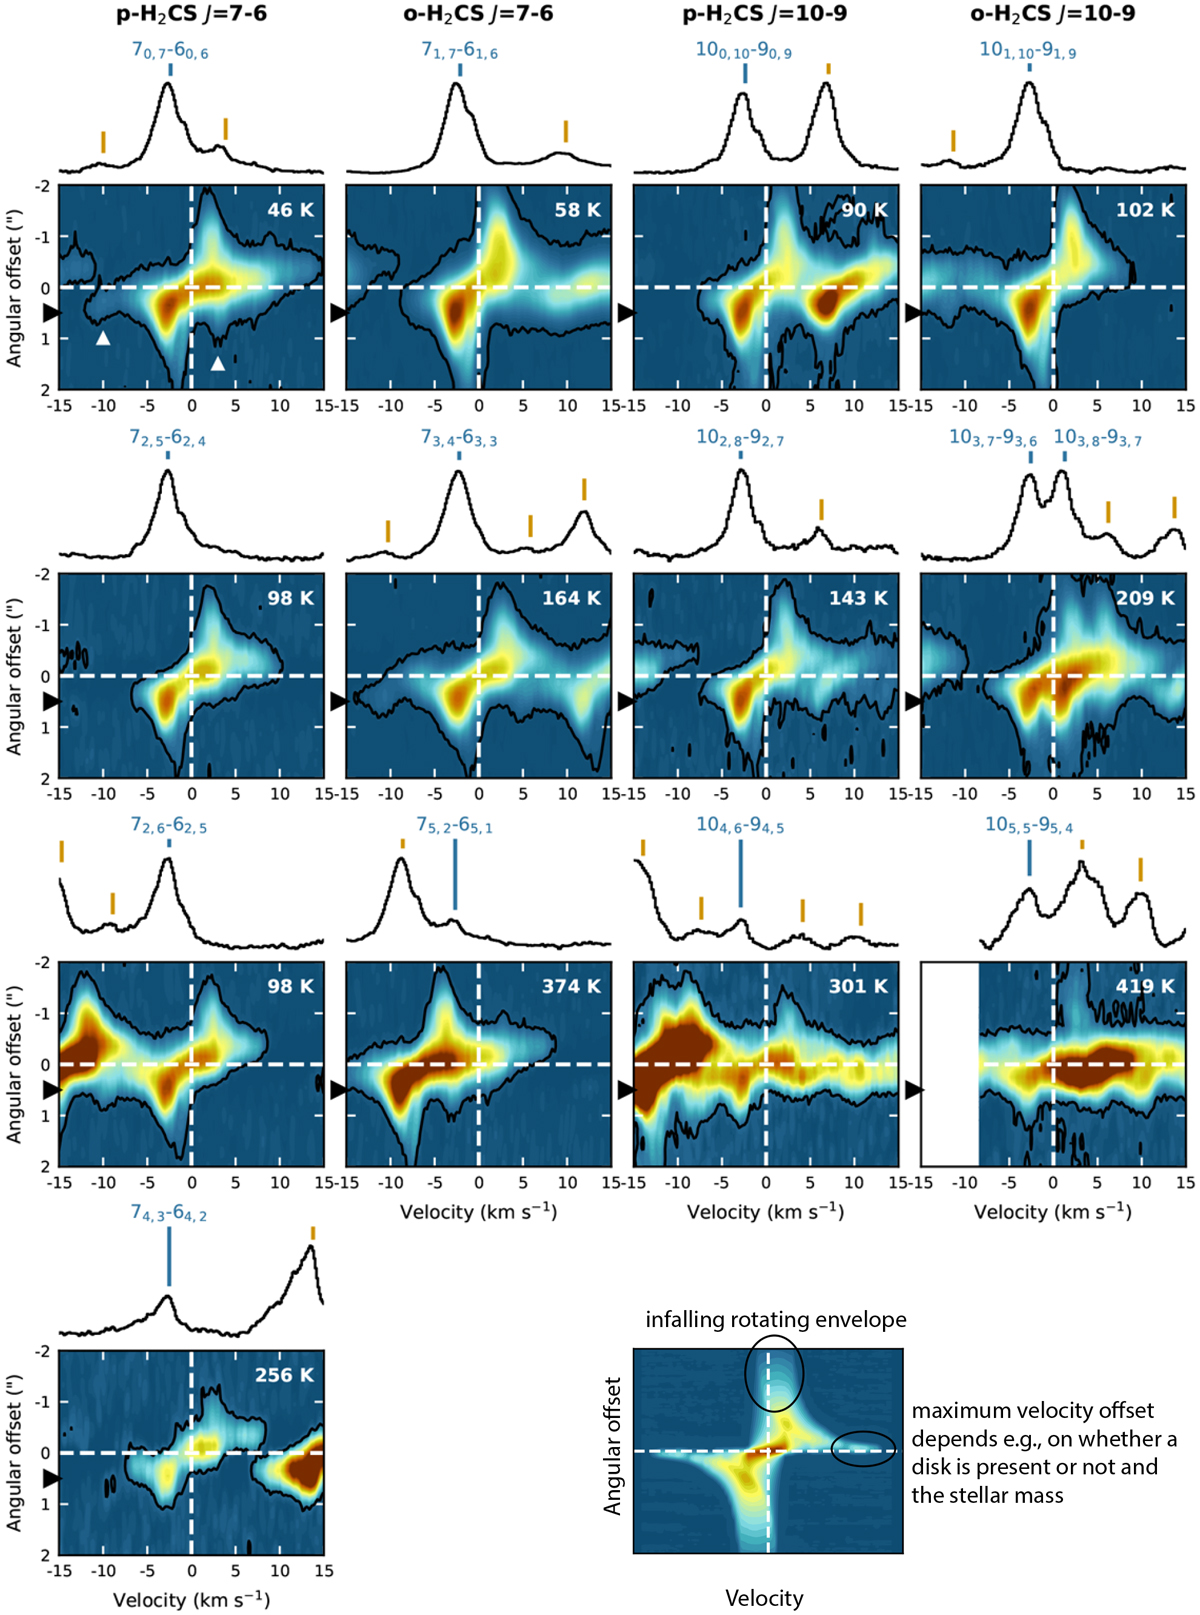
Position–velocity diagrams of the H2CS lines along the major axis (PA = 65°) of the disk-like structure (positive angular offsets denote the northeast direction, i.e., blueshifted emission, negative offsets denote the southwest direction, i.e., redshifted emission). The intensity (color) scale is normalized to the brightest line in each panel. The black contour denotes the 3σ contour. The dashed white lines give the source position and systemic velocity of 3.8 km s−1 (shifted to 0 km s−1). The upper level energy is denoted in the top right corner of each panel. The spectra at ~0.5′′ northeast of the source (indicated by black triangles left of the vertical axes) are superimposed on the pv diagram panels. The H2 CS lines are identified by a vertical blue line, other lines by vertical orange lines. The white triangles in the top left panel highlight blending of the 70,7–60,6 line. For reference, bottom right panel: pv diagram for a thin-disk model with Keplerian disk and infalling rotating envelope.
Current usage metrics show cumulative count of Article Views (full-text article views including HTML views, PDF and ePub downloads, according to the available data) and Abstracts Views on Vision4Press platform.
Data correspond to usage on the plateform after 2015. The current usage metrics is available 48-96 hours after online publication and is updated daily on week days.
Initial download of the metrics may take a while.