Fig. 2
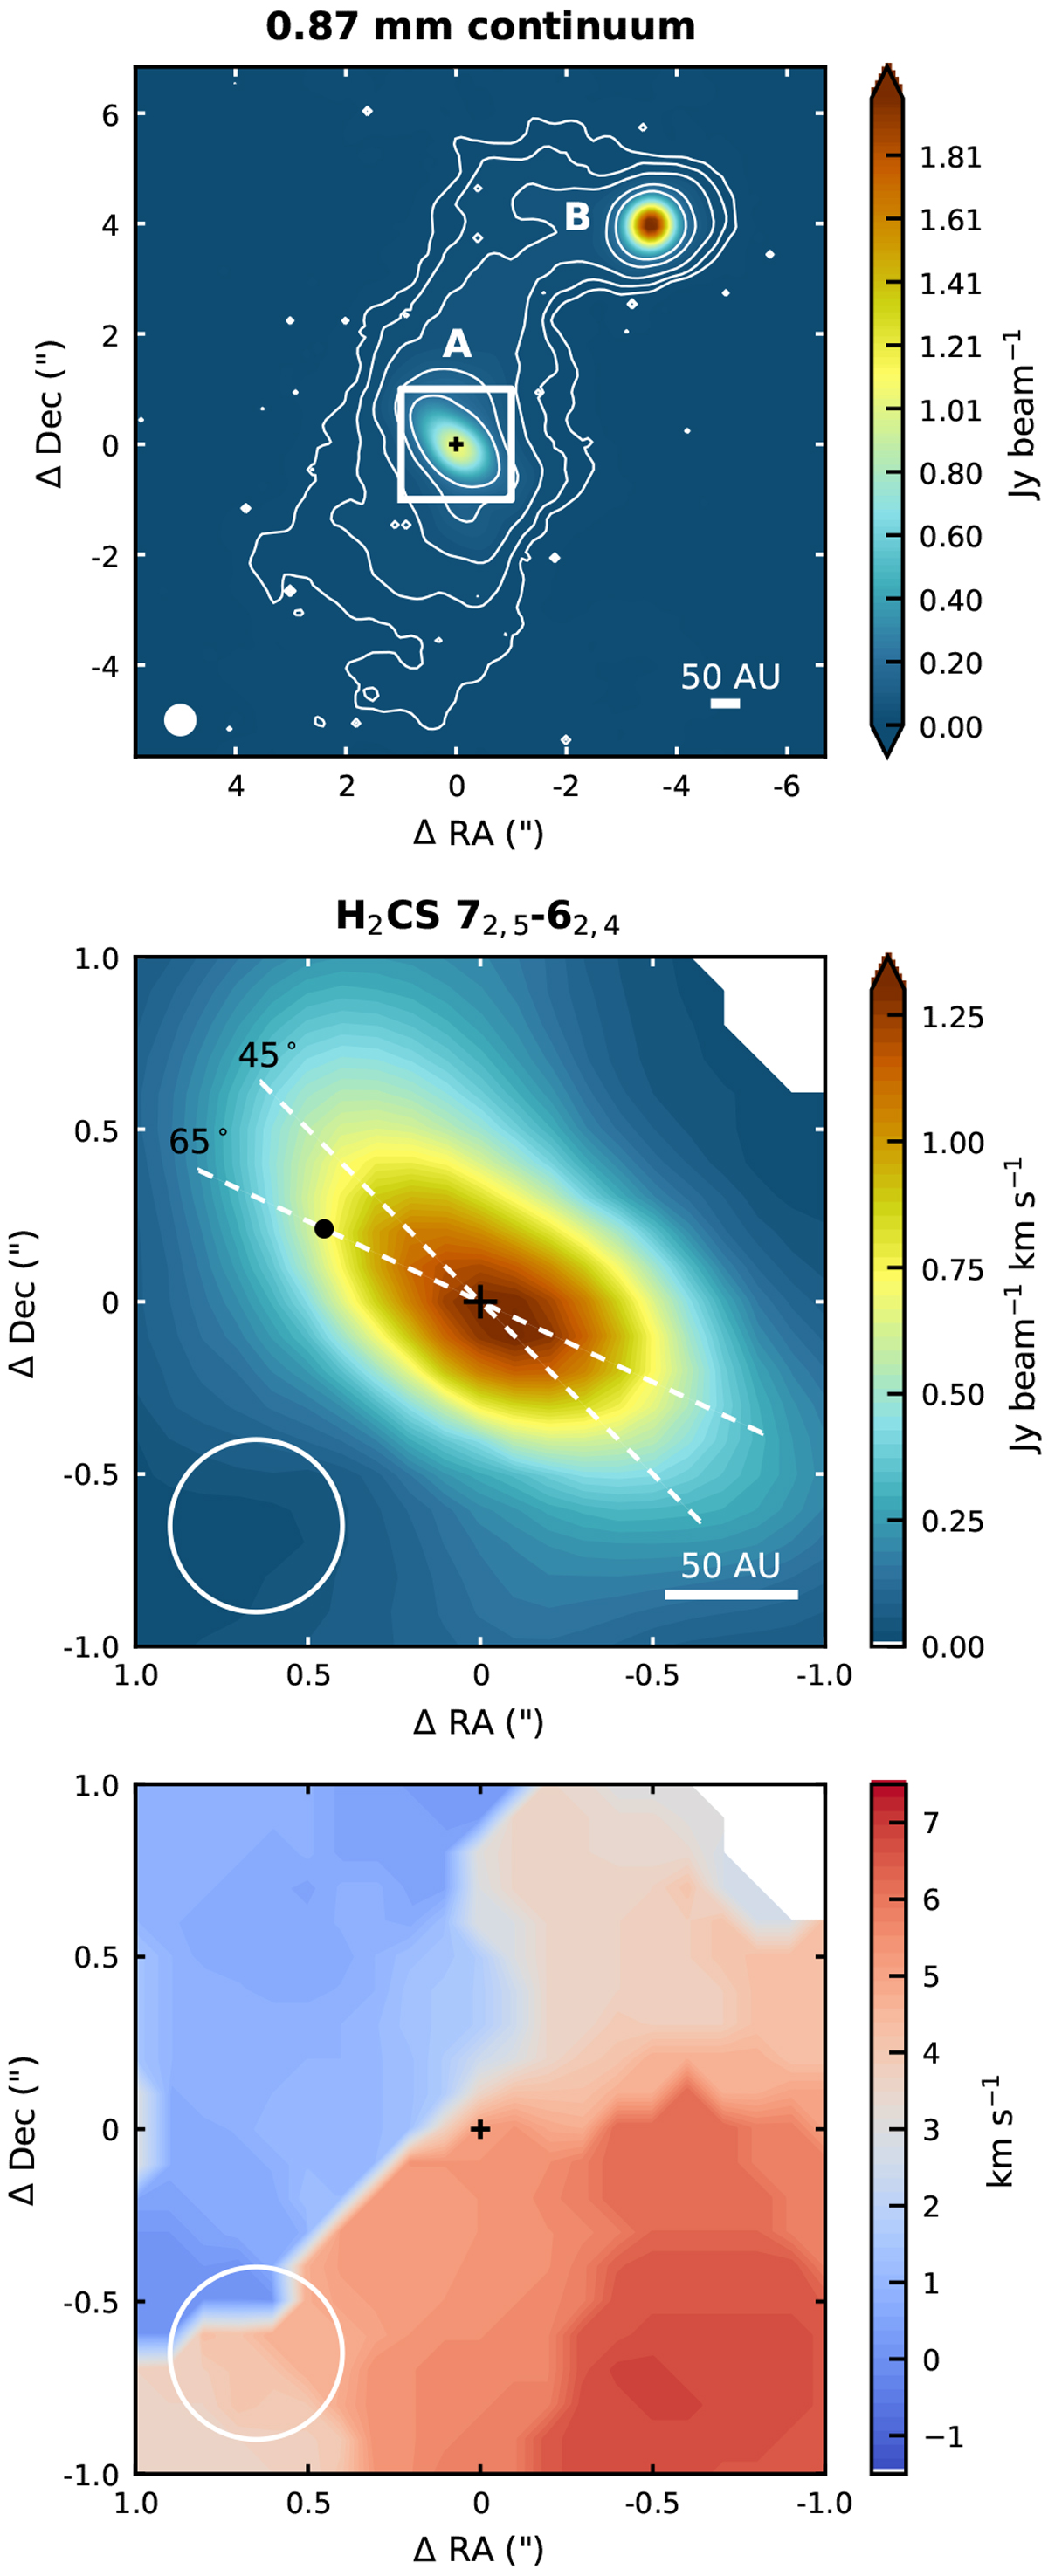
Continuum image of IRAS 16293 at 0.87 mm (top panel) with contour levels at 0.5, 1, 2, 5, and 10% of the peak flux. The white box indicates the region around the A source for which the velocity-corrected integrated emission (VINE) map of the H2 CS 72,5–62,4 line at 240.549 GHz (Eu = 99 K) is shown in the middle panel, and the peak velocity at each position in the bottom panel. The continuum peak position of IRAS 16293A is marked with a cross in all panels and the beam is depicted in the lower left corners. The white lines in the middle panel indicate the position angle of the major axis of the disk-like structure found by Oya et al. (2016) (65°) and our by-eye best matching position angle of 45°. The black circle gives the position where the spectra in Fig. 3 are extracted.
Current usage metrics show cumulative count of Article Views (full-text article views including HTML views, PDF and ePub downloads, according to the available data) and Abstracts Views on Vision4Press platform.
Data correspond to usage on the plateform after 2015. The current usage metrics is available 48-96 hours after online publication and is updated daily on week days.
Initial download of the metrics may take a while.