Fig. D.1
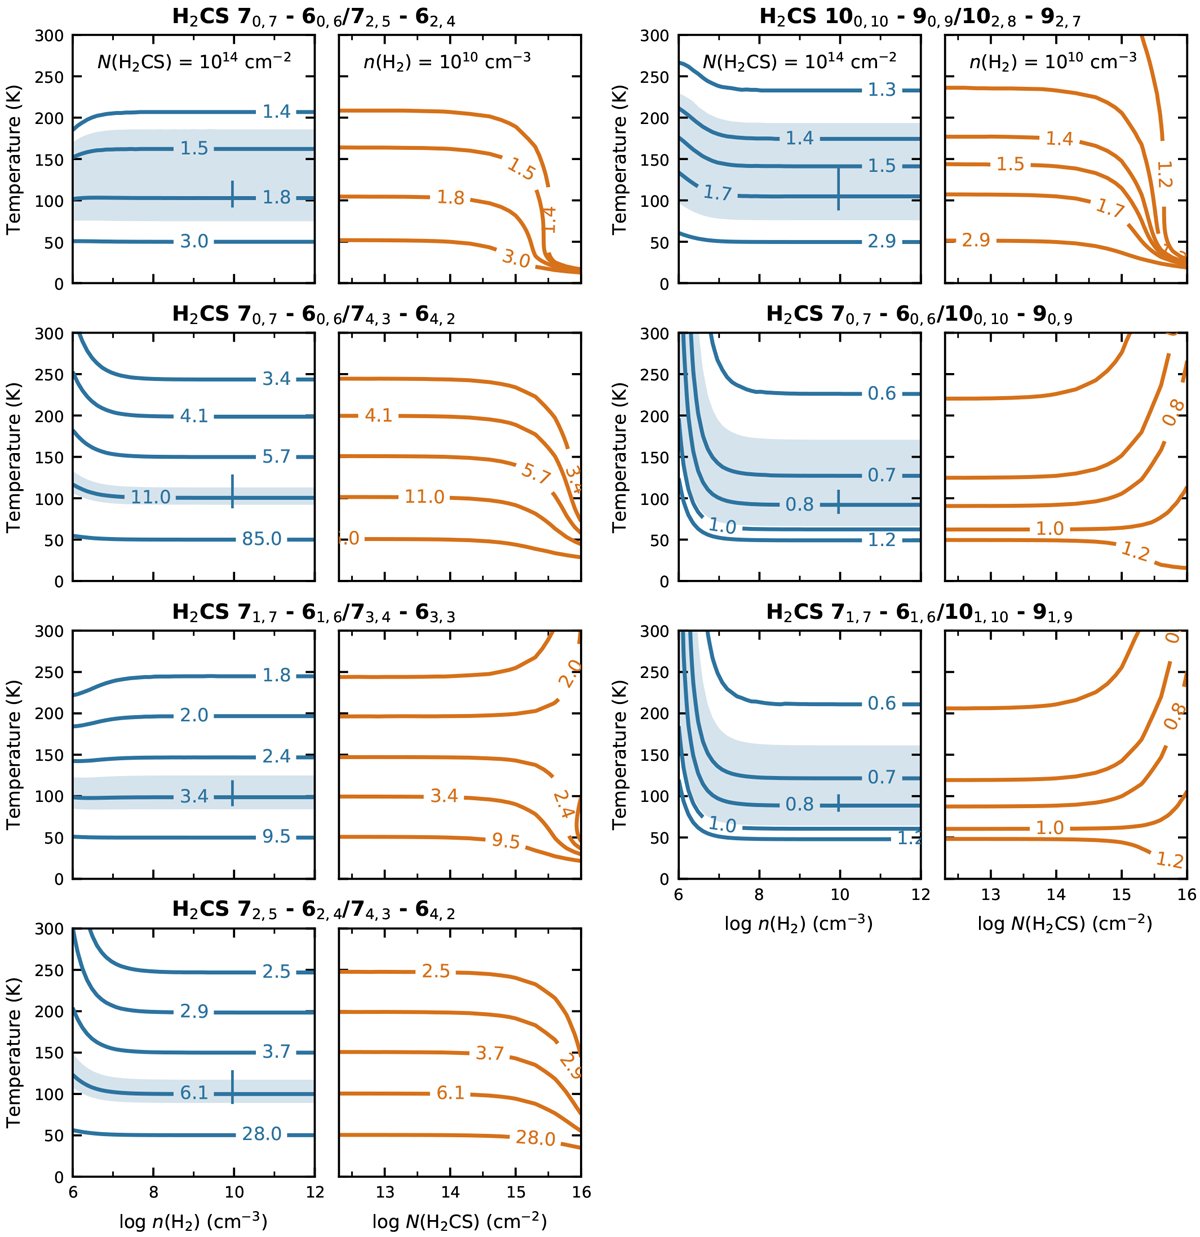
Temperature sensitivity of the H2CS line ratios as a function of H2 density (blue lines) and H2CS column density (orange lines). For the density plots, a H2CS column density of 1014 cm−2 is adopted for both o-H2CS and p-H2CS, and a H2 density of 1010 cm−3 is used for the column density plots. The line ratio is listed above the panels and contours are for the ratios at temperatures of 50, 100, 150, 200, and 250 K. The blue shaded area shows the change in derived temperature if the 100 K ratio changes by 20%. The blue vertical line represents the typical 3σ error on thetemperature based on the observed uncertainty in the line ratio solely due to the rms in the images. The 70,7–60,6/72,5–62,4 ratio is equalto the 70,7–60,6/72,6–62,5 ratio (not shown) and the 72,5–62,4/74,3–64,2 ratio is equalto the 72,6–62,5/74,3–64,2 ratio (not shown).
Current usage metrics show cumulative count of Article Views (full-text article views including HTML views, PDF and ePub downloads, according to the available data) and Abstracts Views on Vision4Press platform.
Data correspond to usage on the plateform after 2015. The current usage metrics is available 48-96 hours after online publication and is updated daily on week days.
Initial download of the metrics may take a while.