Fig. C.1
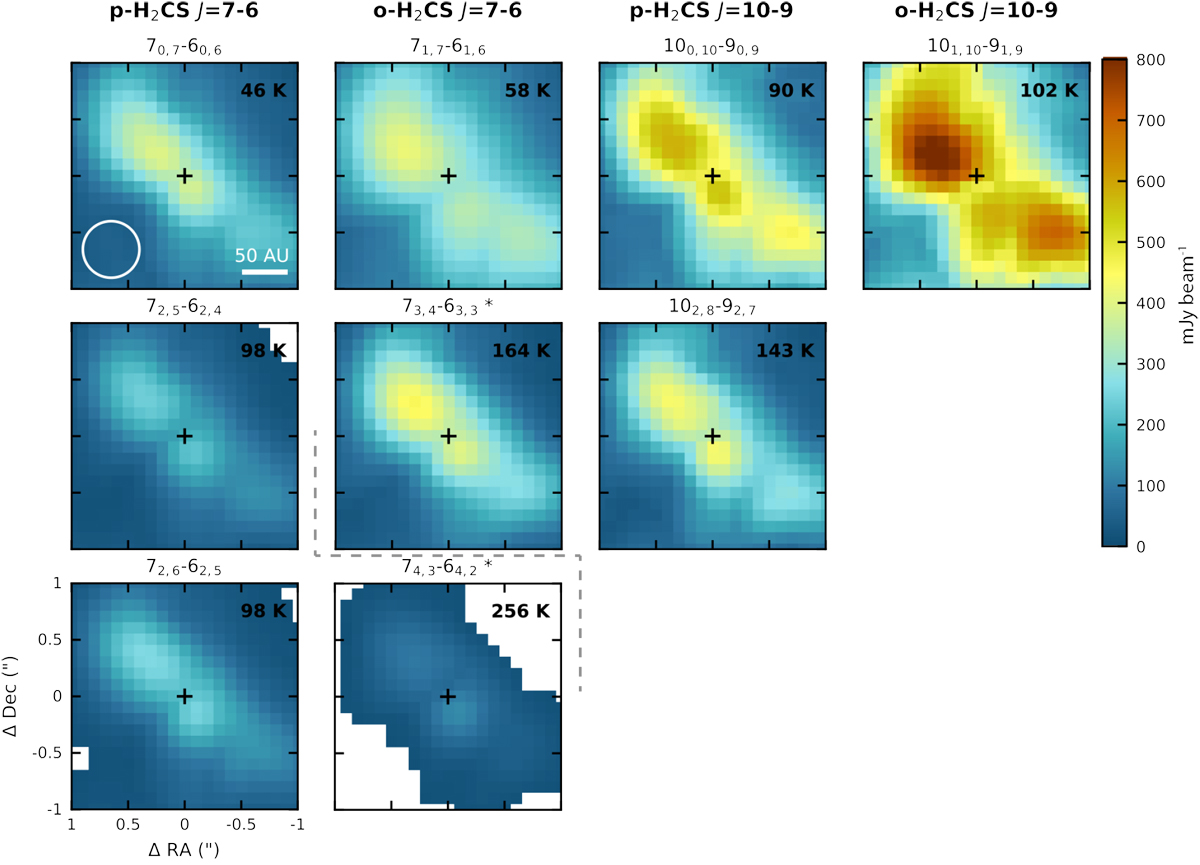
Maps of the peak fluxes (moment 8) of the H2CS lines. Only lines for which reliable peak fluxes could be extracted in the center (i.e., that are not too blended) are shown. The transitions are denoted above the panels and the corresponding upper level energies are listed in the top right corner of each panel. Asterisks (*) behind the transition indicate that the flux is coming from two lines with the same J and Ka level located at the same frequency (see Table A.1 for details). All panels are shown at the same intensity (color) scale for comparison. Pixels with no emission >3σ are masked out. The continuum peak position is marked with a black cross and the beam is depicted in the lower left corner of the top left panel.
Current usage metrics show cumulative count of Article Views (full-text article views including HTML views, PDF and ePub downloads, according to the available data) and Abstracts Views on Vision4Press platform.
Data correspond to usage on the plateform after 2015. The current usage metrics is available 48-96 hours after online publication and is updated daily on week days.
Initial download of the metrics may take a while.