Fig. 1
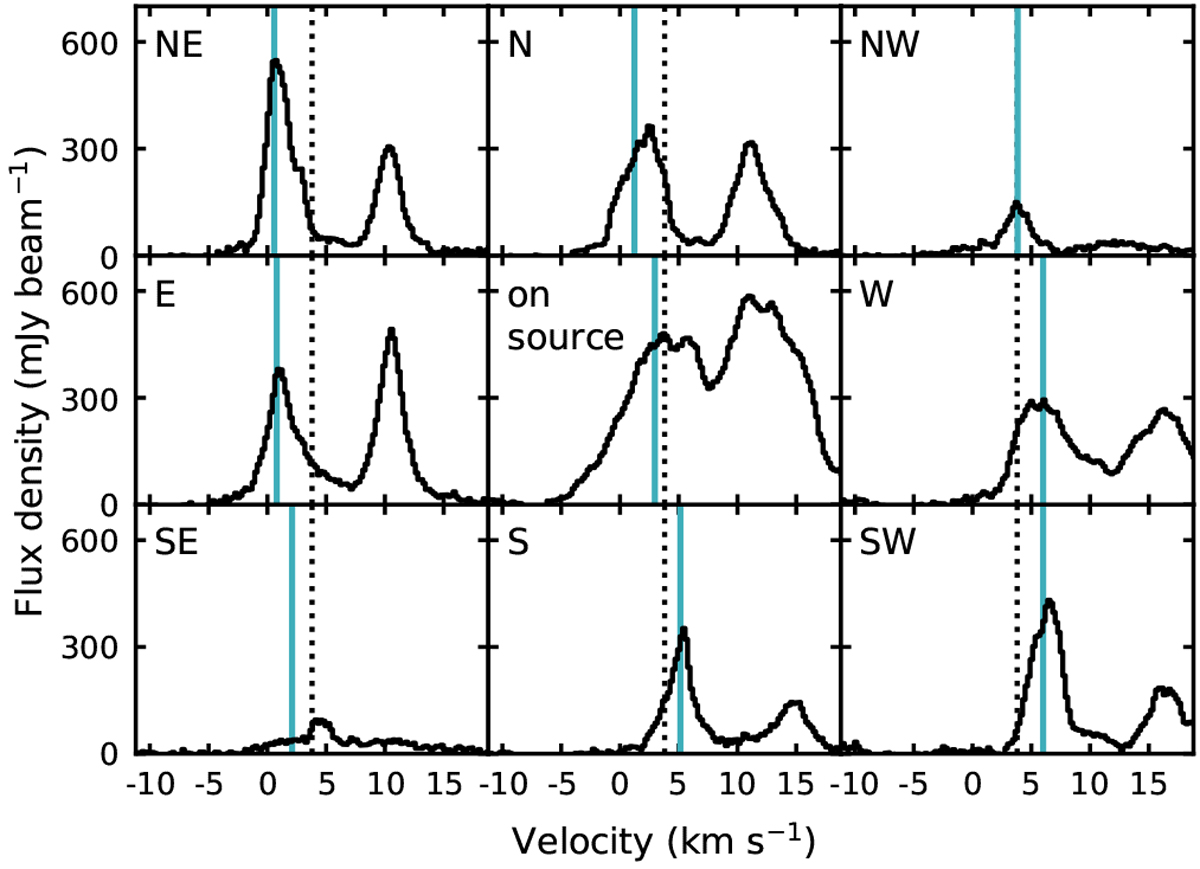
Spectra of the H2CS 100,10–90,9 line at nine positions toward IRAS 16293A illustrating the variation in line blending across the source. Central panel: spectrum in the central pixel (continuum peak); the other spectra are taken at a beam offset (0.5′′) in the different directions denoted in the top left corner of each panel. The vertical dotted line marks the system velocity of 3.8 km s−1, and the vertical blue solid line indicates the peak velocity from the CH3OH line used to isolate the target lines (in this case H2CS 100,10–90,9).
Current usage metrics show cumulative count of Article Views (full-text article views including HTML views, PDF and ePub downloads, according to the available data) and Abstracts Views on Vision4Press platform.
Data correspond to usage on the plateform after 2015. The current usage metrics is available 48-96 hours after online publication and is updated daily on week days.
Initial download of the metrics may take a while.