Fig. 9
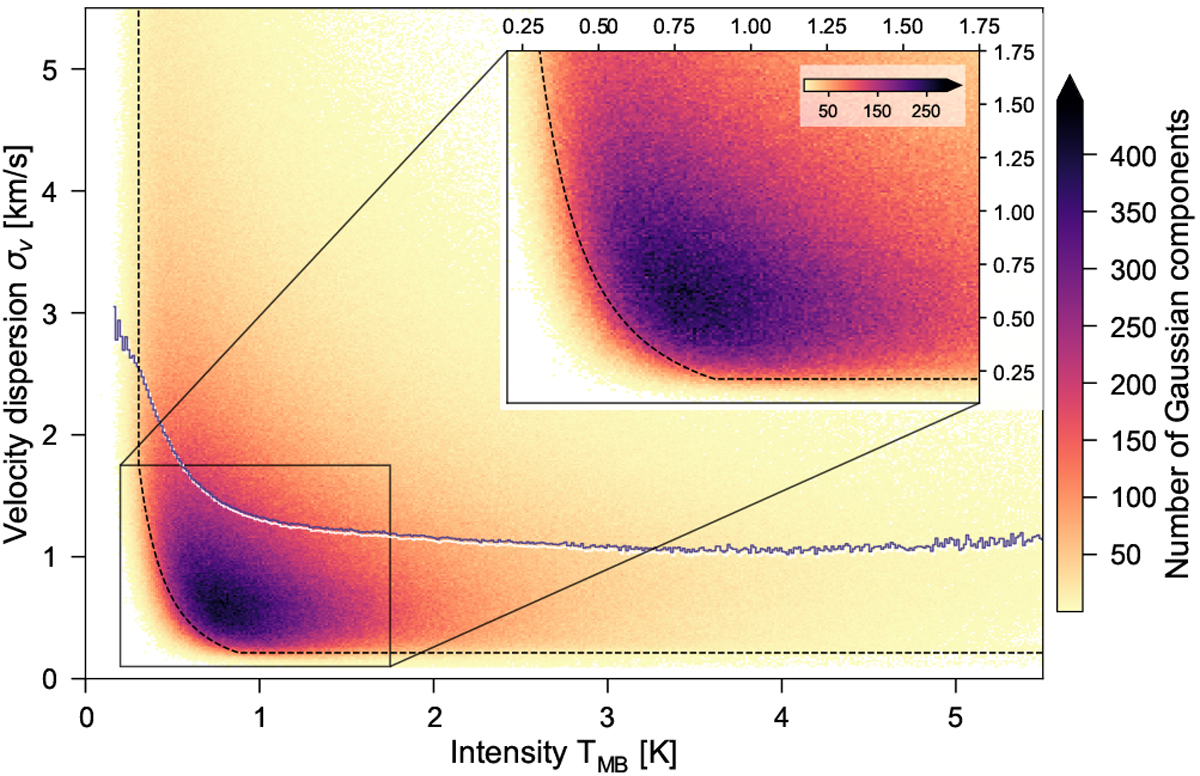
2D histogram of intensity and velocity dispersion values for all fit components. The dashed line shows the lower limit for a chosen significance value of ![]() and a velocity dispersion value corresponding to the spectral resolution limit of the survey (0.21 km s−1). The blue line shows the mean σv value per intensity bin. The number of bins in either direction is 400. The inset is a zoom-in of the most dense region of the distribution and uses a finer grid with 175 bins in either direction.
and a velocity dispersion value corresponding to the spectral resolution limit of the survey (0.21 km s−1). The blue line shows the mean σv value per intensity bin. The number of bins in either direction is 400. The inset is a zoom-in of the most dense region of the distribution and uses a finer grid with 175 bins in either direction.
Current usage metrics show cumulative count of Article Views (full-text article views including HTML views, PDF and ePub downloads, according to the available data) and Abstracts Views on Vision4Press platform.
Data correspond to usage on the plateform after 2015. The current usage metrics is available 48-96 hours after online publication and is updated daily on week days.
Initial download of the metrics may take a while.