Fig. 3
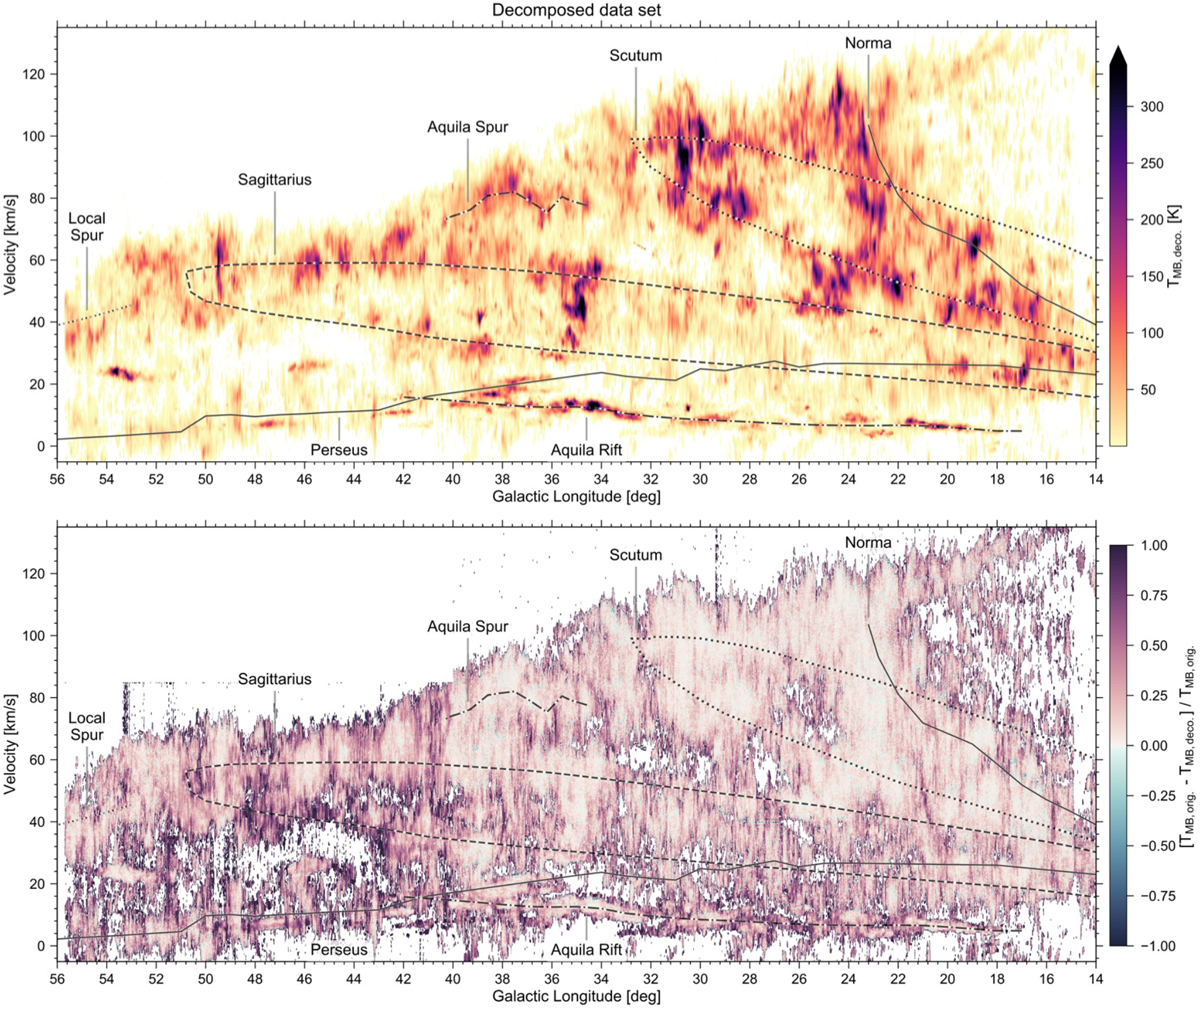
Top: PV map of the decomposed GRS data set. The emission was integrated over the full Galactic latitude range (± 1.1°). When displayed in Adobe Acrobat, it is possible to switch to the map of the original data set. Bottom: map of the normalised residual values. Overplotted on both panels are positions of spiral arms, spurs, and local Galactic features from Reid et al. (2016).
Current usage metrics show cumulative count of Article Views (full-text article views including HTML views, PDF and ePub downloads, according to the available data) and Abstracts Views on Vision4Press platform.
Data correspond to usage on the plateform after 2015. The current usage metrics is available 48-96 hours after online publication and is updated daily on week days.
Initial download of the metrics may take a while.