Fig. C.4
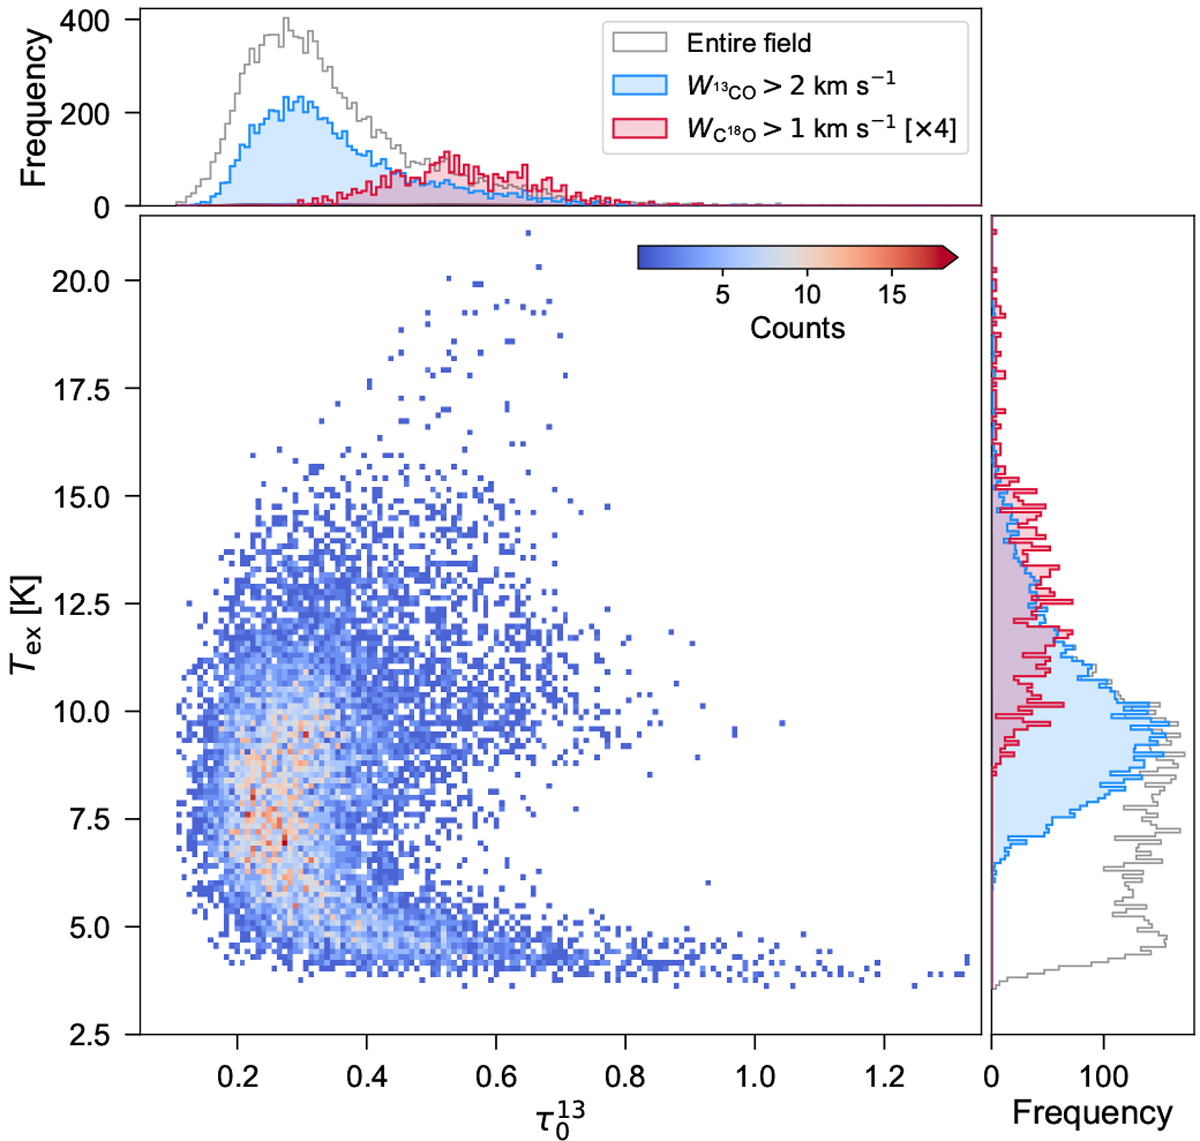
2D distribution of determined Tex and ![]() values shown in Fig. C.2b and c. Marginal distributions on top and to the right are for the entire region shown in Fig. C.2 (unfilled histograms), and subsets of the region within the
values shown in Fig. C.2b and c. Marginal distributions on top and to the right are for the entire region shown in Fig. C.2 (unfilled histograms), and subsets of the region within the ![]() K km s−1 contour (blue histograms) and the region within the
K km s−1 contour (blue histograms) and the region within the ![]() K km s−1 contour (red histograms; the counts are scaled by a factor 4 for better visibility).
K km s−1 contour (red histograms; the counts are scaled by a factor 4 for better visibility).
Current usage metrics show cumulative count of Article Views (full-text article views including HTML views, PDF and ePub downloads, according to the available data) and Abstracts Views on Vision4Press platform.
Data correspond to usage on the plateform after 2015. The current usage metrics is available 48-96 hours after online publication and is updated daily on week days.
Initial download of the metrics may take a while.