Fig. C.3
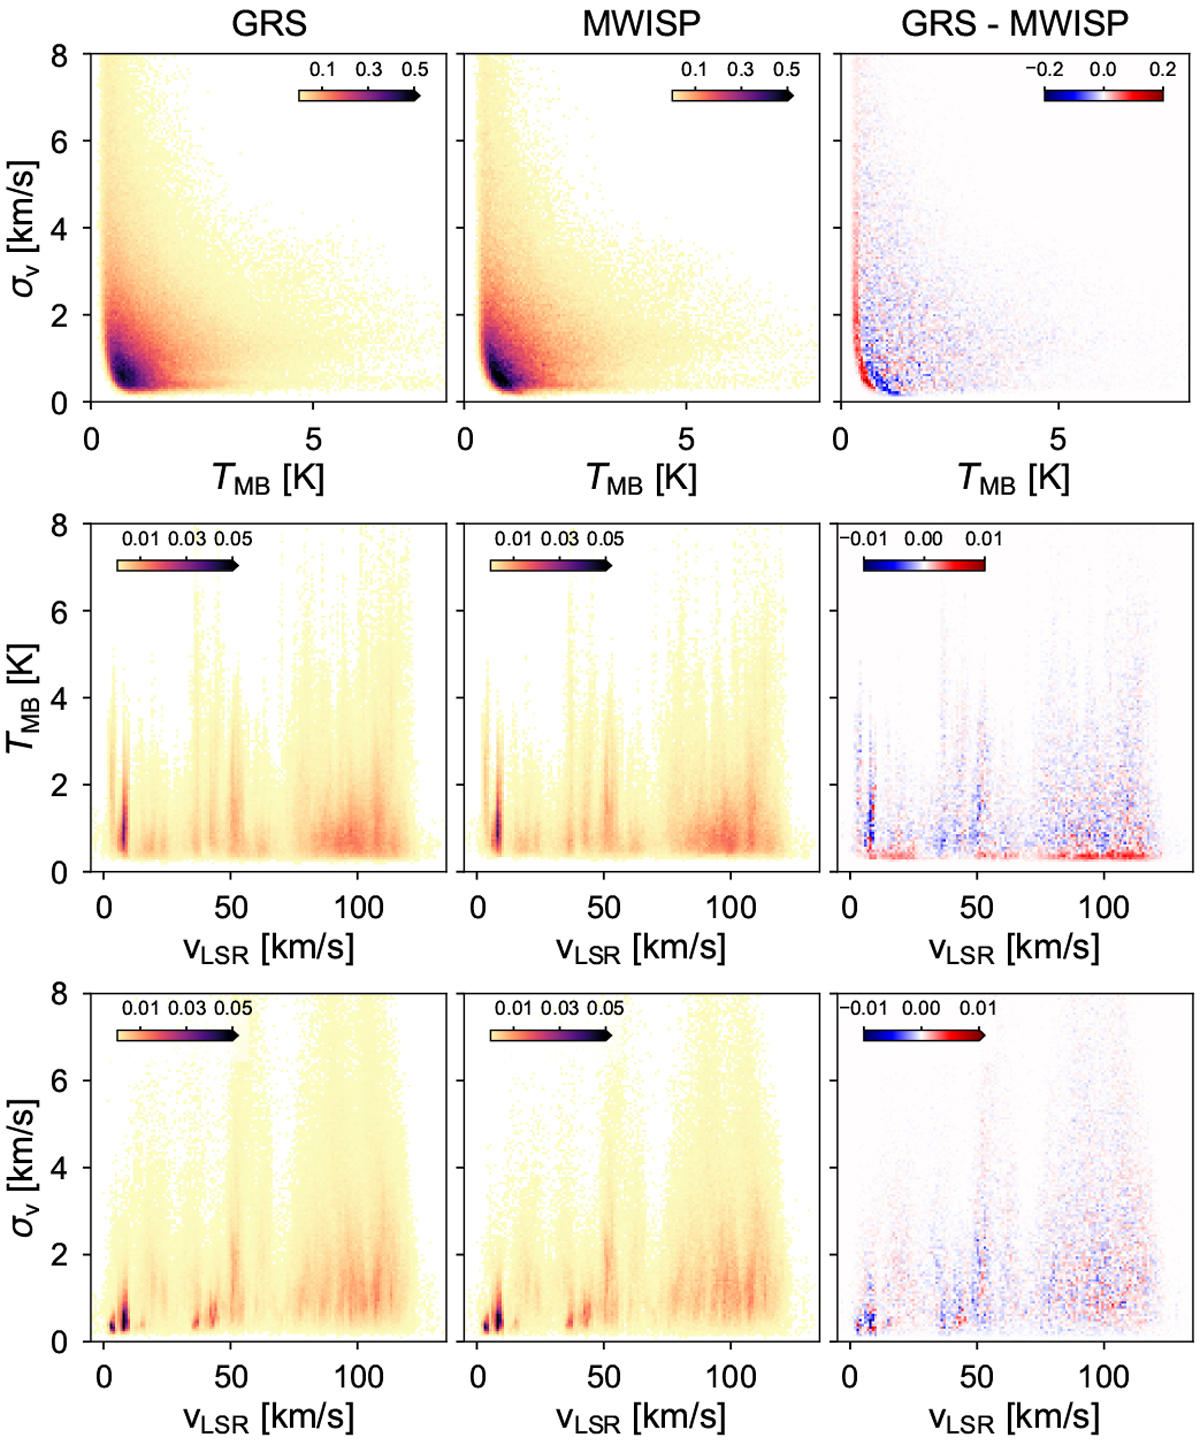
Distributions of fit parameters for the decomposition of the GRS (left), MWISP (middle), and the difference between the two data sets (right). The rows show normalised 2D histograms of: peak main beam brightness temperature and velocity dispersion values (top), centroid velocity and peak main beam brightness temperature values (middle), centroid velocity and velocity dispersion values (bottom). Colourbars in all panels indicate the values of the normalised 2D distributions.
Current usage metrics show cumulative count of Article Views (full-text article views including HTML views, PDF and ePub downloads, according to the available data) and Abstracts Views on Vision4Press platform.
Data correspond to usage on the plateform after 2015. The current usage metrics is available 48-96 hours after online publication and is updated daily on week days.
Initial download of the metrics may take a while.