Fig. C.2
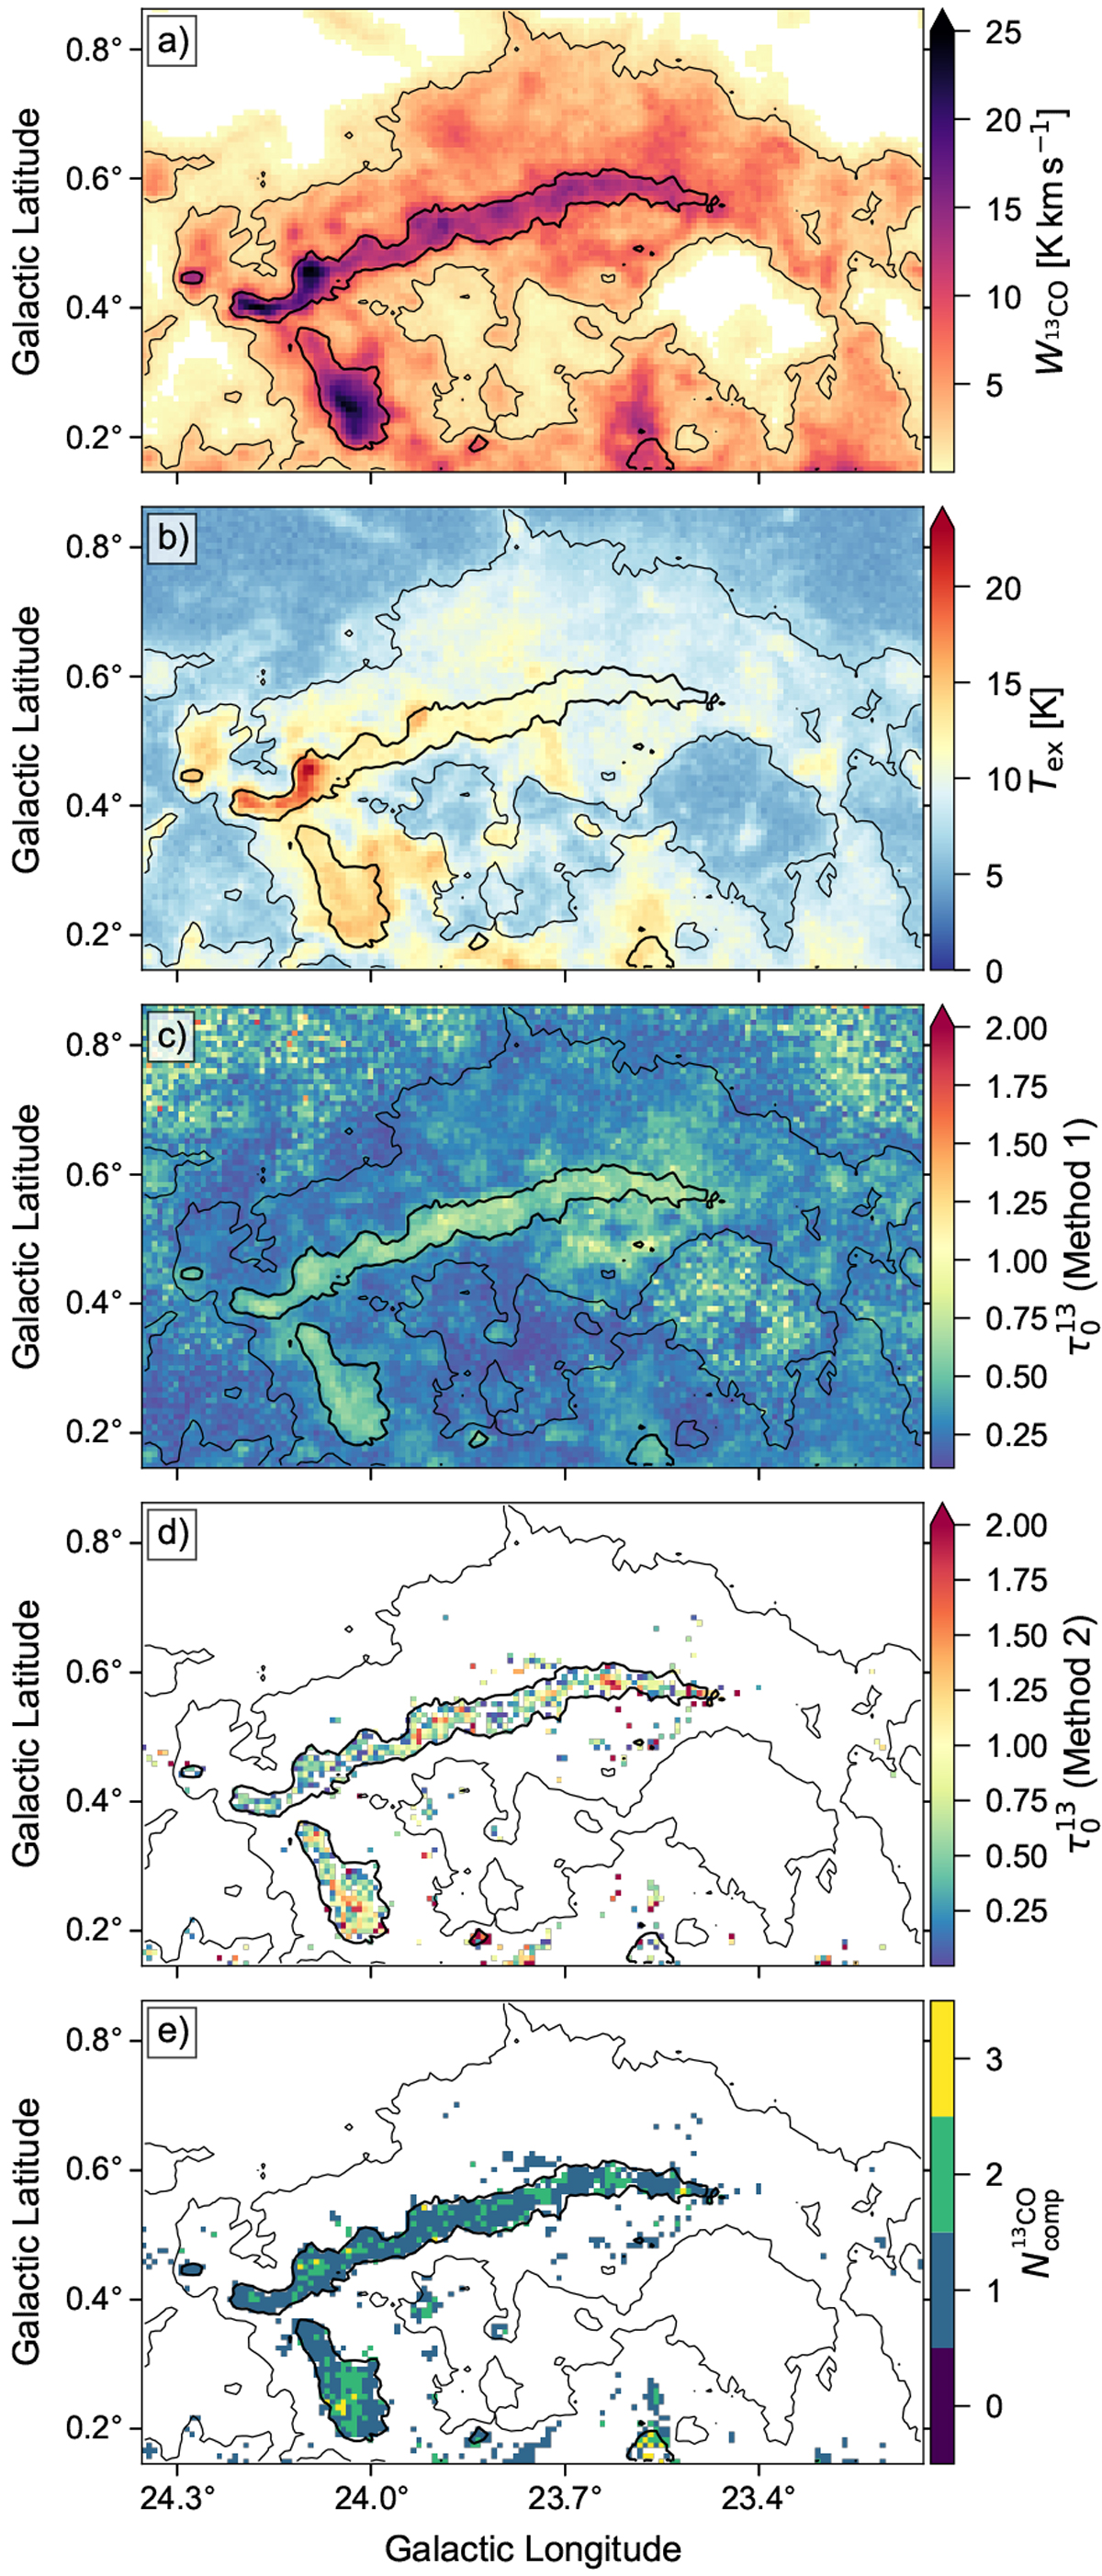
Maps for the region containing the elongated molecular cloud G24. (a) Zeroth moment map of the 13CO emission.(b) Map of determined excitation temperature values. (c) Map of determined ![]() values using Method 1 (Appendix C.2.1). (d) Map of determined
values using Method 1 (Appendix C.2.1). (d) Map of determined ![]() values using Method 2 (Appendix C.2.2). (e) Map showing the number of 13CO fit components associated with a single C18O fit component. The black contours indicate
values using Method 2 (Appendix C.2.2). (e) Map showing the number of 13CO fit components associated with a single C18O fit component. The black contours indicate ![]() values of 2 K km s−1 (thin line) and
values of 2 K km s−1 (thin line) and ![]() values of 1 K km s−1 (thick line). All maps were obtained from voxels between 93 < vLSR < 99 km s−1.
values of 1 K km s−1 (thick line). All maps were obtained from voxels between 93 < vLSR < 99 km s−1.
Current usage metrics show cumulative count of Article Views (full-text article views including HTML views, PDF and ePub downloads, according to the available data) and Abstracts Views on Vision4Press platform.
Data correspond to usage on the plateform after 2015. The current usage metrics is available 48-96 hours after online publication and is updated daily on week days.
Initial download of the metrics may take a while.