Open Access
Fig. 2
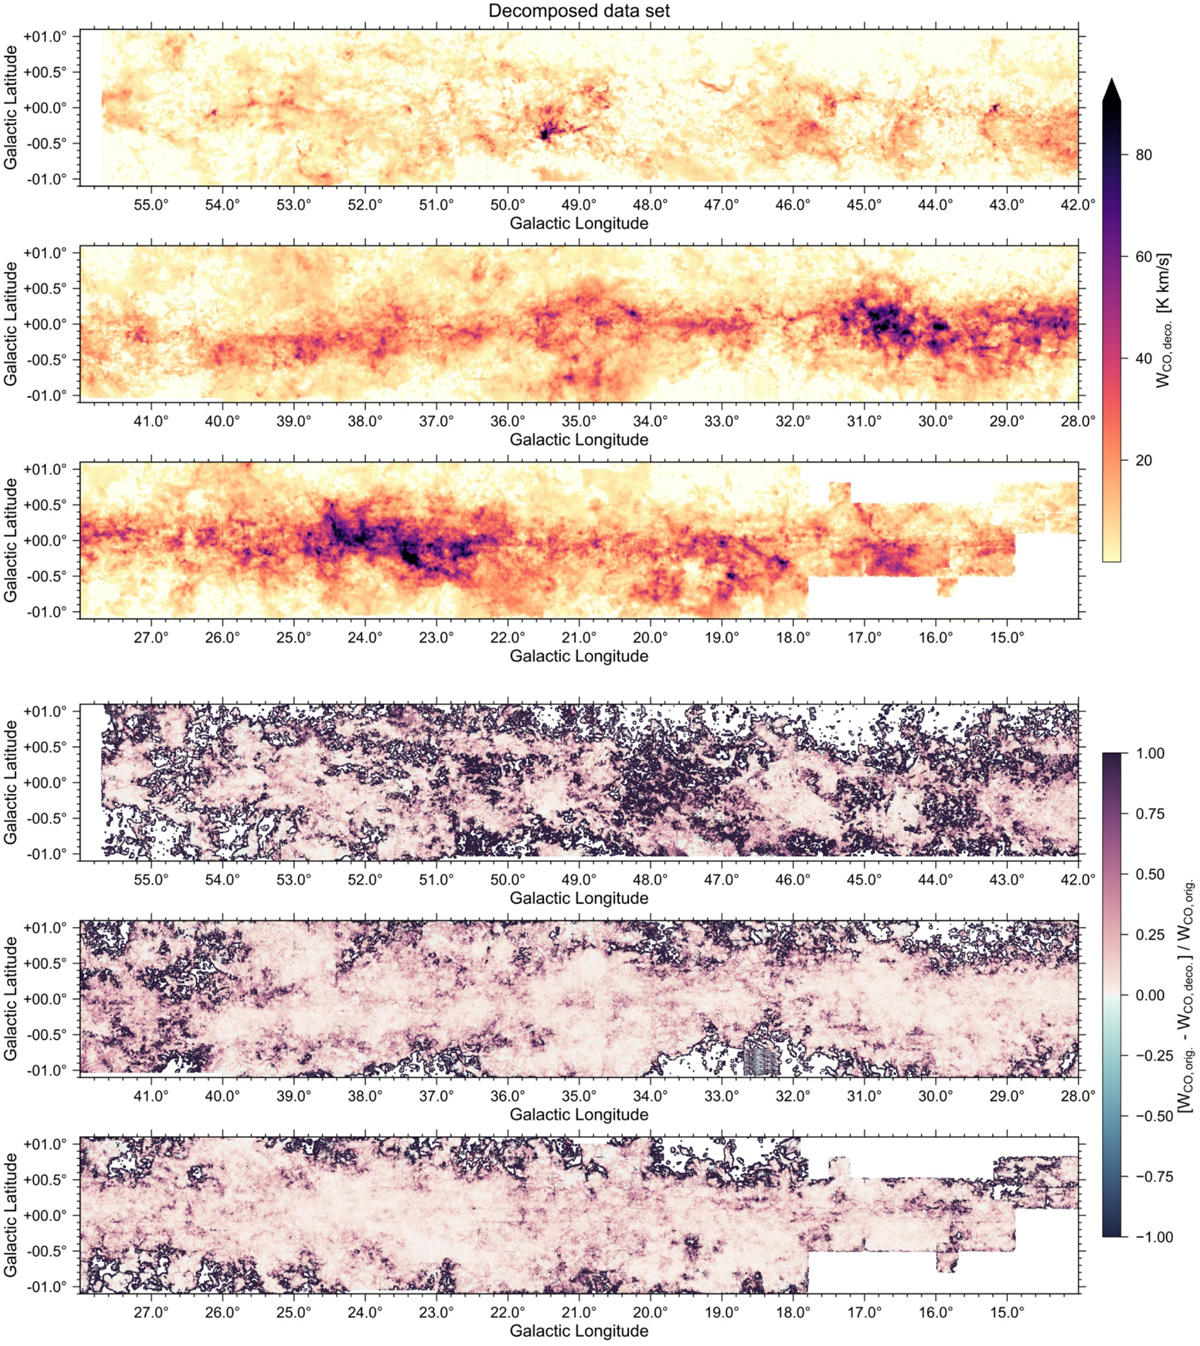
Top: zeroth moment map of the GRS data set recreated from the Gaussian fit components and integrated over the entire velocity range (− 5 ≲ vLSR ≲ 135 km s−1). When displayed in Adobe Acrobat, it is possible to switch to the map of the original data set. Bottom: map of the normalised residual values.
Current usage metrics show cumulative count of Article Views (full-text article views including HTML views, PDF and ePub downloads, according to the available data) and Abstracts Views on Vision4Press platform.
Data correspond to usage on the plateform after 2015. The current usage metrics is available 48-96 hours after online publication and is updated daily on week days.
Initial download of the metrics may take a while.