Fig. B.3
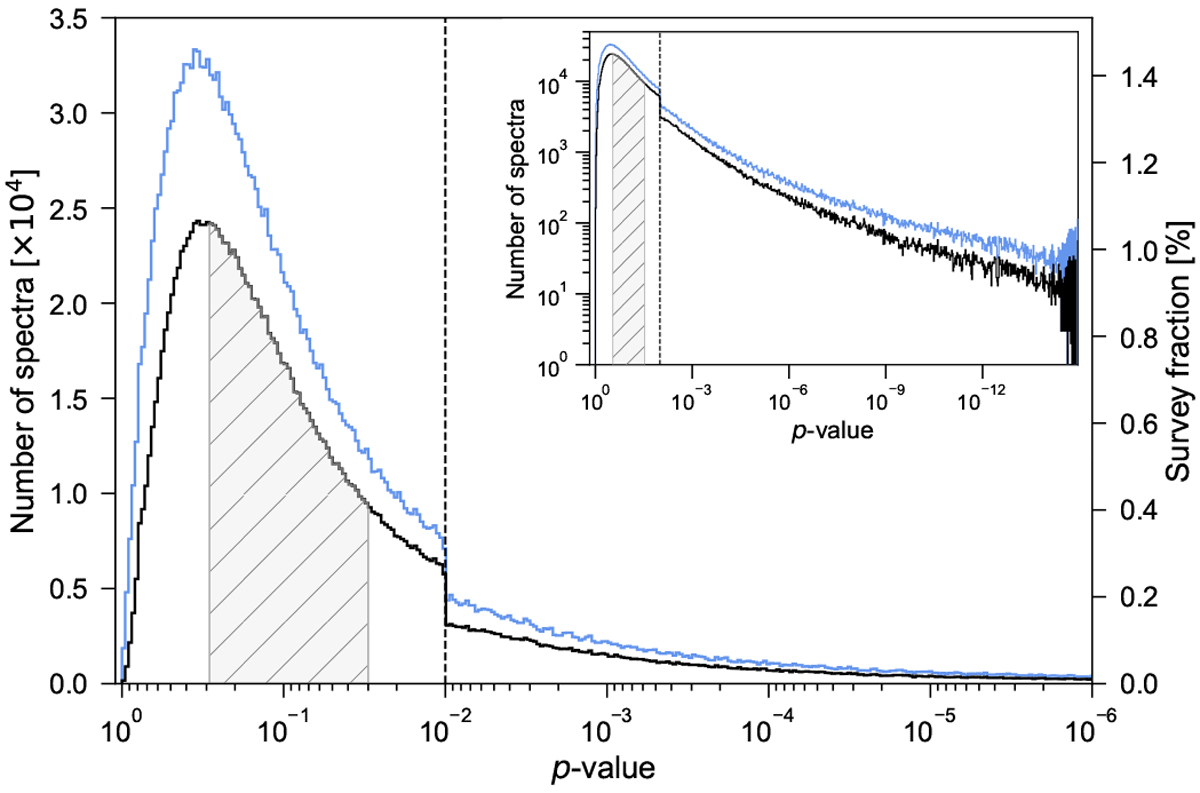
Histogram of p-values from normality tests for the distribution of residual values for all GRS spectra (blue) and GRS spectra that have at least one fit component (black). The inset shows the same distribution on a logarithmic scale. The dashed vertical line marks the default p-value limit, below which GAUSSPY+ tries to refit spectra if possible. The grey-shaded area marks the IQR for the distribution of spectra with fitted components, ranging from about 0.03−0.3. The bin width is 0.02 dex.
Current usage metrics show cumulative count of Article Views (full-text article views including HTML views, PDF and ePub downloads, according to the available data) and Abstracts Views on Vision4Press platform.
Data correspond to usage on the plateform after 2015. The current usage metrics is available 48-96 hours after online publication and is updated daily on week days.
Initial download of the metrics may take a while.