Fig. B.2
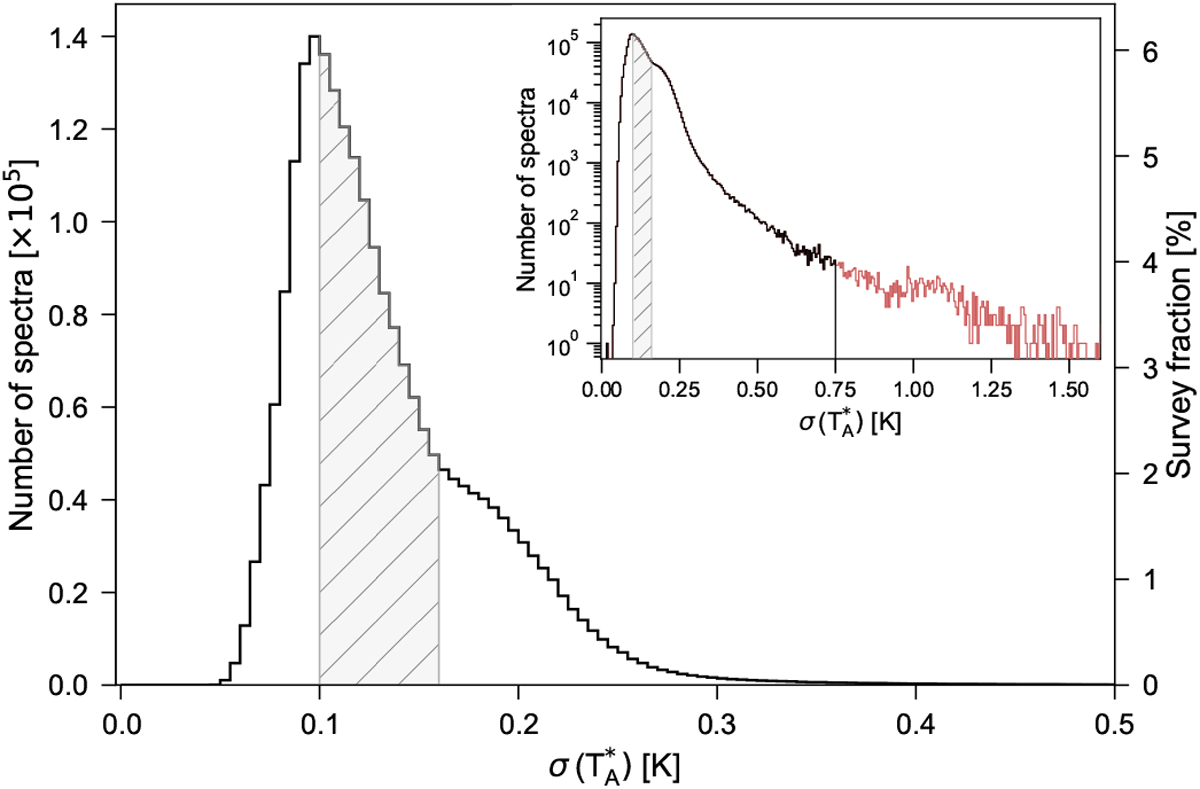
Histogram of determined rms noise (given in antenna temperature values) for all spectra in the GRS. Theinset shows the same distribution on a logarithmic scale. The red line in the inset indicates masked out spectra with high noise values. The grey-shaded area marks the IQR, ranging from about 0.1− 0.16 K. The bin width is 0.005 K.
Current usage metrics show cumulative count of Article Views (full-text article views including HTML views, PDF and ePub downloads, according to the available data) and Abstracts Views on Vision4Press platform.
Data correspond to usage on the plateform after 2015. The current usage metrics is available 48-96 hours after online publication and is updated daily on week days.
Initial download of the metrics may take a while.