Fig. 16
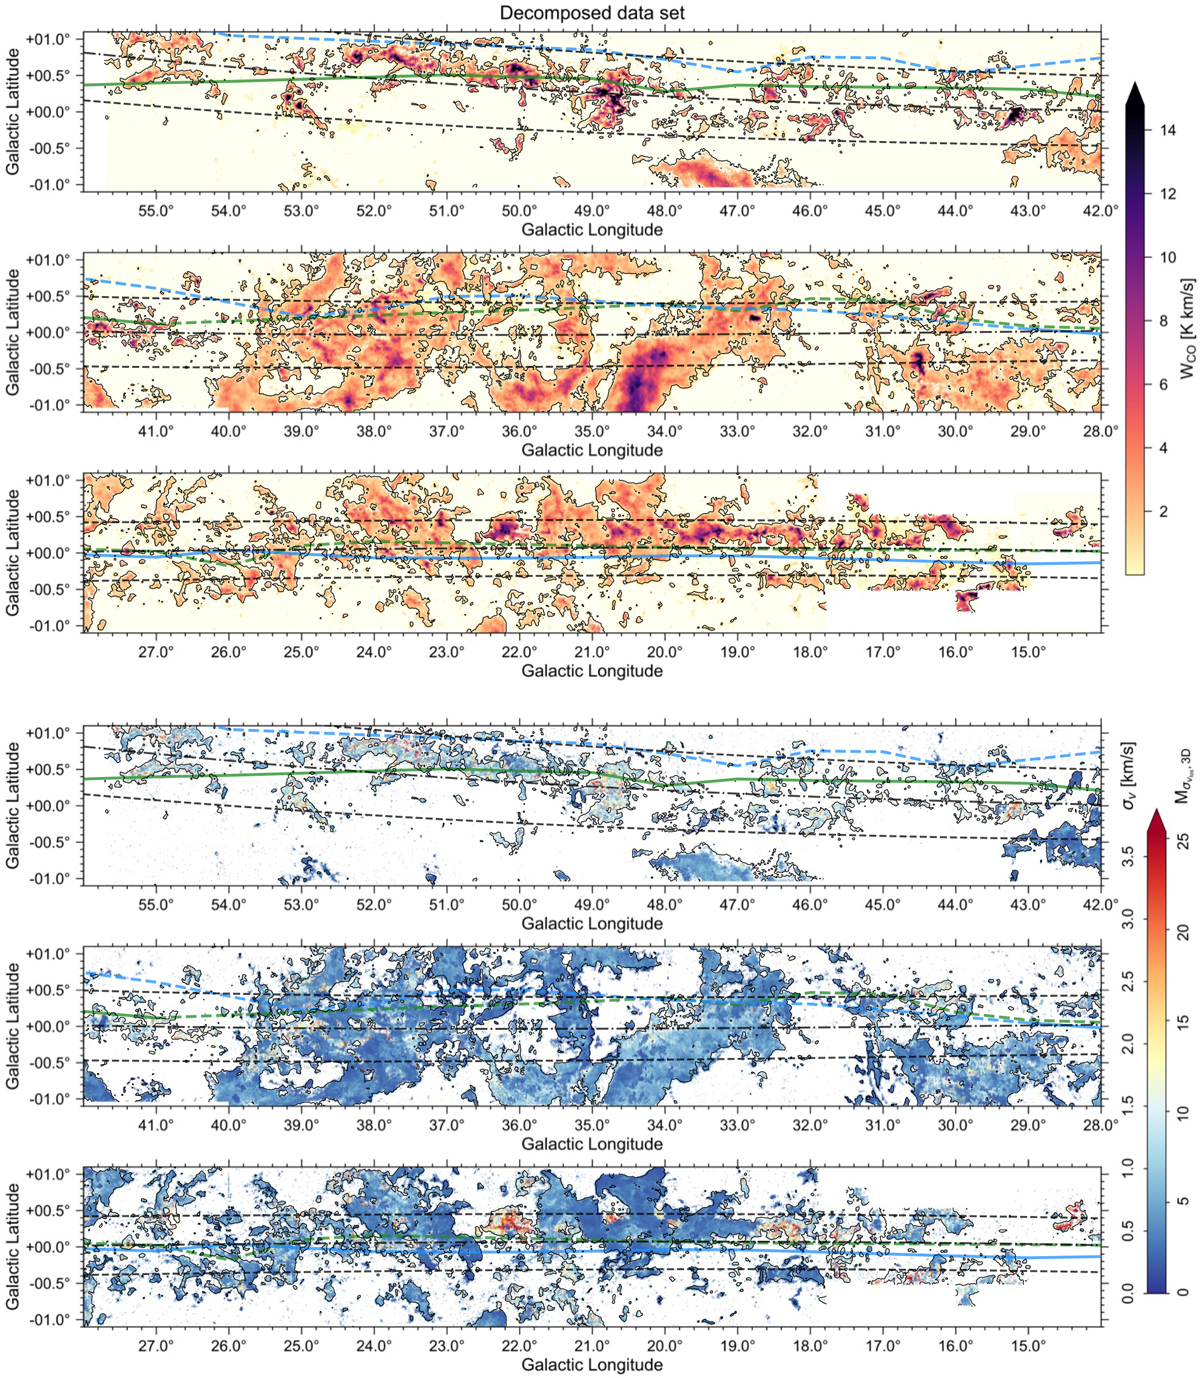
Top: zeroth moment map of the decomposed data set integrated within − 5 < vLSR < 20 km s−1. Bottom: velocity dispersion values for the narrowest fit component within the same vLSR range as used in the top panel. The second scaling on the colourbar indicates corresponding estimates for upper limits of the turbulent Mach number. In both panels we show: the position of the Perseus and Outer spiral arms as inferred by Reid et al. (2019) (green and blue lines, respectively, cf. Fig. 15); black contours indicating a WCO value of 0.5 K km s−1; a fit to the positions with σv values >1 km s−1 (dash-dotted black line); and the estimated FWHM extent of the molecular gas disk on the far side of the Milky Way (dashed black lines). See Sect. 6.4 for more details. When displayed in Adobe Acrobat, it is possible to switch to the channel map of the original data set, show only the positions with σv values > 1 km s−1, hide the contours, hide the fit to the positions with σv values > 1 km s−1 and estimated FWHM extent of the gas disk, and hide the positions of the Perseus arm and Outer arm.
Current usage metrics show cumulative count of Article Views (full-text article views including HTML views, PDF and ePub downloads, according to the available data) and Abstracts Views on Vision4Press platform.
Data correspond to usage on the plateform after 2015. The current usage metrics is available 48-96 hours after online publication and is updated daily on week days.
Initial download of the metrics may take a while.