Fig. 14
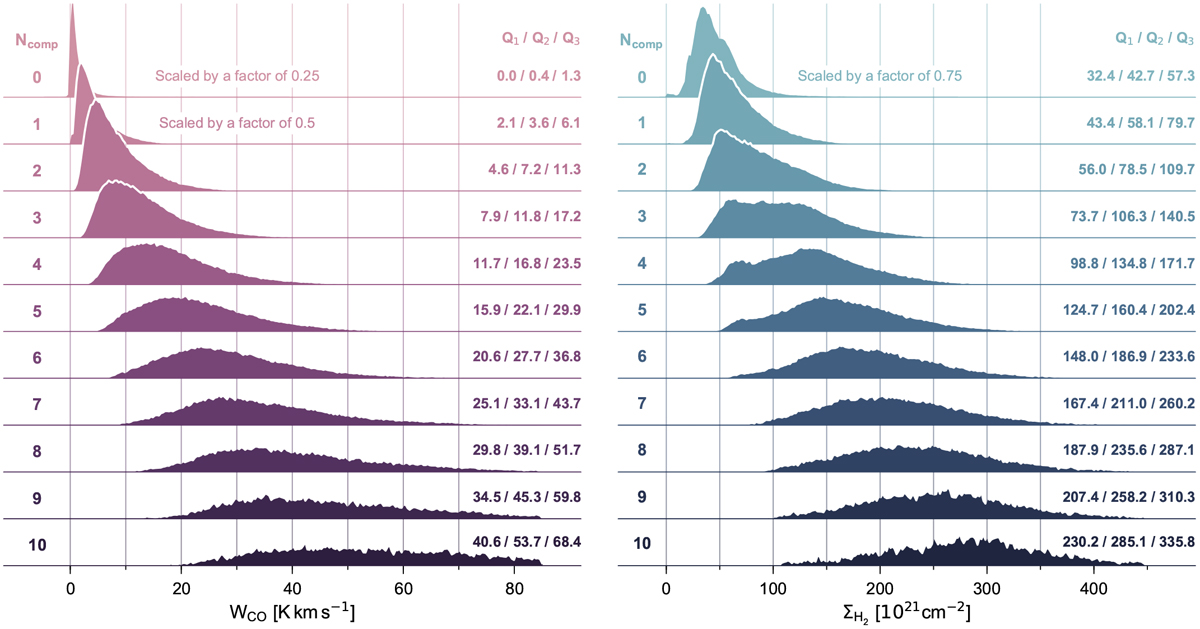
Ridge plots showing PDFs of integrated 13CO emission (left panel) and H2 surface density values inferred from dust emission (right panel). For the left panel, each row shows the PDF of the WCO values of all spectra fitted with Ncomp components (indicated with the number to the left and the colour-shading of the PDF). For the right panel, each row shows the PDF of the ![]() values associated with 13CO spectra fitted with Ncomp components (indicated with the number to the left and the colour-shading of the PDF). For better visibility, three of the PDFs have been scaled in size, which is indicated next to the PDFs. The values to the right of the PDFs indicate the first quartile (Q1), the median (Q2), and the third quartile (Q3) of the distribution.
values associated with 13CO spectra fitted with Ncomp components (indicated with the number to the left and the colour-shading of the PDF). For better visibility, three of the PDFs have been scaled in size, which is indicated next to the PDFs. The values to the right of the PDFs indicate the first quartile (Q1), the median (Q2), and the third quartile (Q3) of the distribution.
Current usage metrics show cumulative count of Article Views (full-text article views including HTML views, PDF and ePub downloads, according to the available data) and Abstracts Views on Vision4Press platform.
Data correspond to usage on the plateform after 2015. The current usage metrics is available 48-96 hours after online publication and is updated daily on week days.
Initial download of the metrics may take a while.