Fig. 13
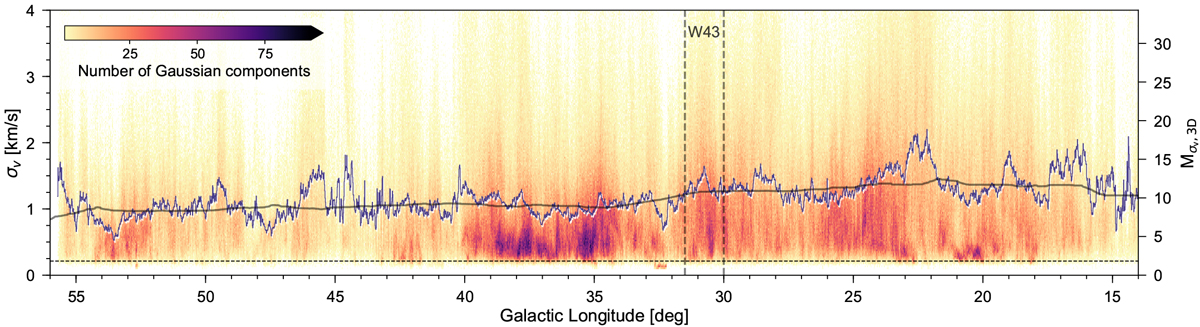
2D histogram of velocity dispersion values against their Galactic longitude positions for all fit components with S∕N > 3. The dashed horizontal line indicates the velocity resolution of 0.21 km s−1. In the horizontal and vertical direction we use 3415 and 200 bins, respectively. The blue line indicates the mean velocity dispersion value per Galactic longitude bin. The grey solid line is a smoothed version of the mean σv curve using a median filter with a kernel of ~3°. Dashed vertical lines show the approximate location of the giant HII region complex W43.
Current usage metrics show cumulative count of Article Views (full-text article views including HTML views, PDF and ePub downloads, according to the available data) and Abstracts Views on Vision4Press platform.
Data correspond to usage on the plateform after 2015. The current usage metrics is available 48-96 hours after online publication and is updated daily on week days.
Initial download of the metrics may take a while.