Open Access
Fig. 12
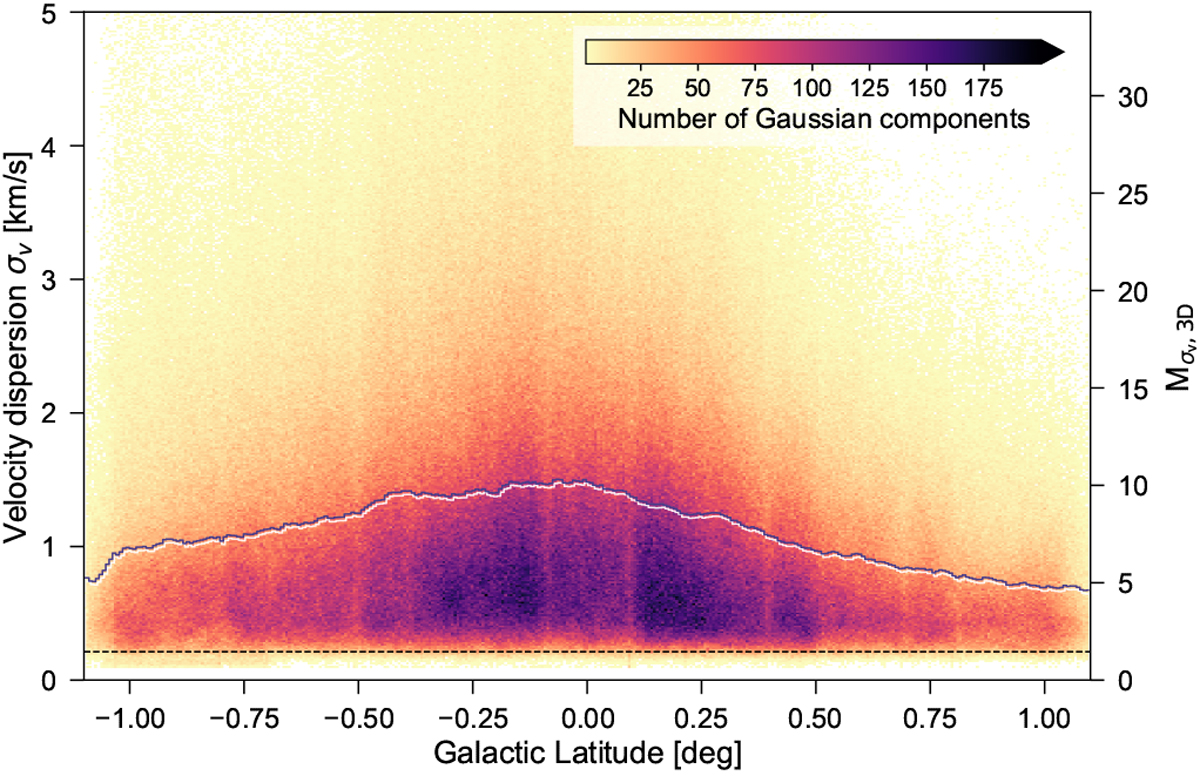
2D histogram of the velocity dispersion values against their Galactic latitude positions for all fit components with S∕N > 3. The dashed horizontal line indicates the velocity resolution of 0.21 km s−1. The blue line shows the mean σv value per Galactic latitude bin. The number of bins used in either direction is 358.
Current usage metrics show cumulative count of Article Views (full-text article views including HTML views, PDF and ePub downloads, according to the available data) and Abstracts Views on Vision4Press platform.
Data correspond to usage on the plateform after 2015. The current usage metrics is available 48-96 hours after online publication and is updated daily on week days.
Initial download of the metrics may take a while.