Fig. 11
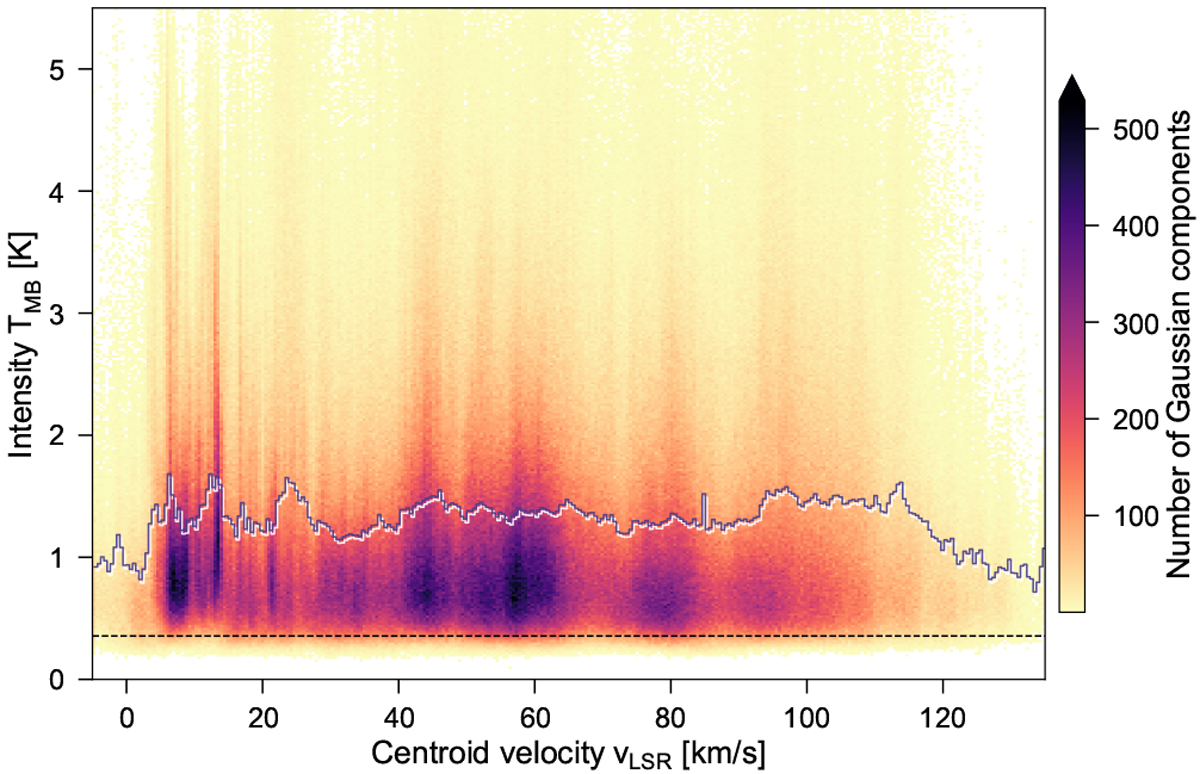
2D histogram of centroid velocity and intensity values for all fit components. The dashed horizontal line indicates a S/N limit of 3 for σ(TMB) = 0.12 K, which corresponds to the 0.1st percentile of the noise distribution shown in Fig. B.2. The blue line shows the mean intensity value per centroid velocity bin. The number of bins in either direction is 300.
Current usage metrics show cumulative count of Article Views (full-text article views including HTML views, PDF and ePub downloads, according to the available data) and Abstracts Views on Vision4Press platform.
Data correspond to usage on the plateform after 2015. The current usage metrics is available 48-96 hours after online publication and is updated daily on week days.
Initial download of the metrics may take a while.