Fig. 1
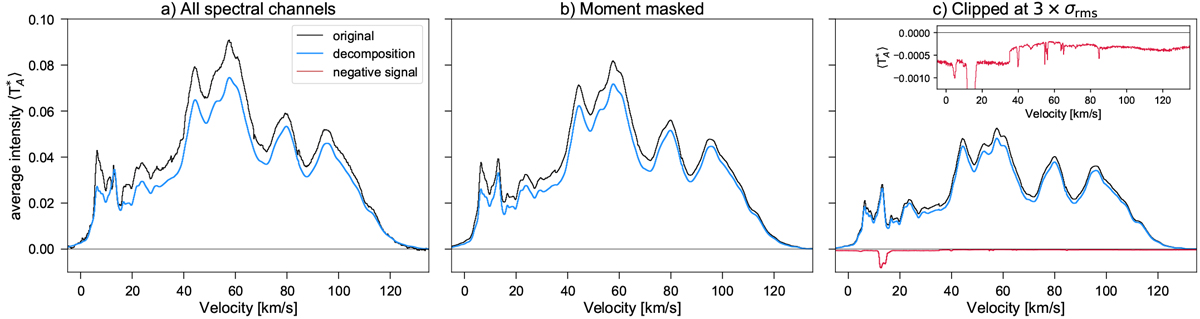
Average spectra of the full GRS data set (grey lines) and our final Gaussian decomposition results (blue lines). The three panels show different ways the average spectra were created: in (a) we use all voxels, in (b) we use only the voxels retained from moment masking, and in (c) we use only voxels whose intensity value is above a S/N threshold of 3. The red line in panel c shows an average of high negative values throughout the GRS data set that was obtained by using only voxels with a value below − 3 × S∕N. The inset inthe right panel shows a zoom-in of the red line to better display the individual smaller negative peaks. See Sect. 3.2 for more details.
Current usage metrics show cumulative count of Article Views (full-text article views including HTML views, PDF and ePub downloads, according to the available data) and Abstracts Views on Vision4Press platform.
Data correspond to usage on the plateform after 2015. The current usage metrics is available 48-96 hours after online publication and is updated daily on week days.
Initial download of the metrics may take a while.