Fig. 11
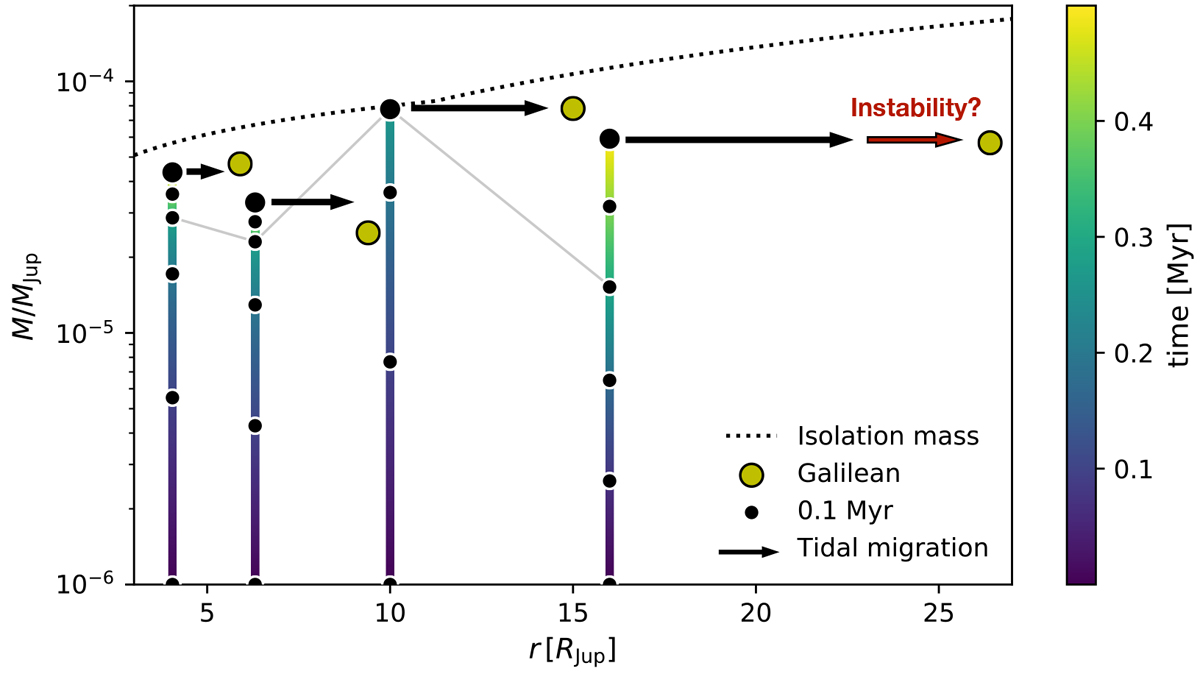
Example of pebble accretion growth tracks of Galilean moons analogs trapped in their mutual 2:1 mean motion resonances in a Jovian CPD with an accretion timescale onto Jupiter τacc = 10 Myr (see text for details). The growth tracks are shown as thick colored lines, where the color gives an indication of time. For further readability, black dots on the growth tracks show time intervals of 0.1 Myr and the larger dots indicate the end state of the system after 0.5 Myr of accretion. The thin gray line connects the system at the time Ganymede reaches the pebble isolation mass, which is after ≈0.3 Myr for our adopted value of Ṁ0 = 3 × 10⁻⁹ Mp yr−1. Tidal migration after the dissipation of the CPD can bring the orbits of the three inner satellites to their current location (Yoder & Peale 1981). Another mechanism, such as a dynamical instability, is however required to account for the fact that the outermost moon, Callisto, is presently outside of the resonance system.
Current usage metrics show cumulative count of Article Views (full-text article views including HTML views, PDF and ePub downloads, according to the available data) and Abstracts Views on Vision4Press platform.
Data correspond to usage on the plateform after 2015. The current usage metrics is available 48-96 hours after online publication and is updated daily on week days.
Initial download of the metrics may take a while.