Fig. 9
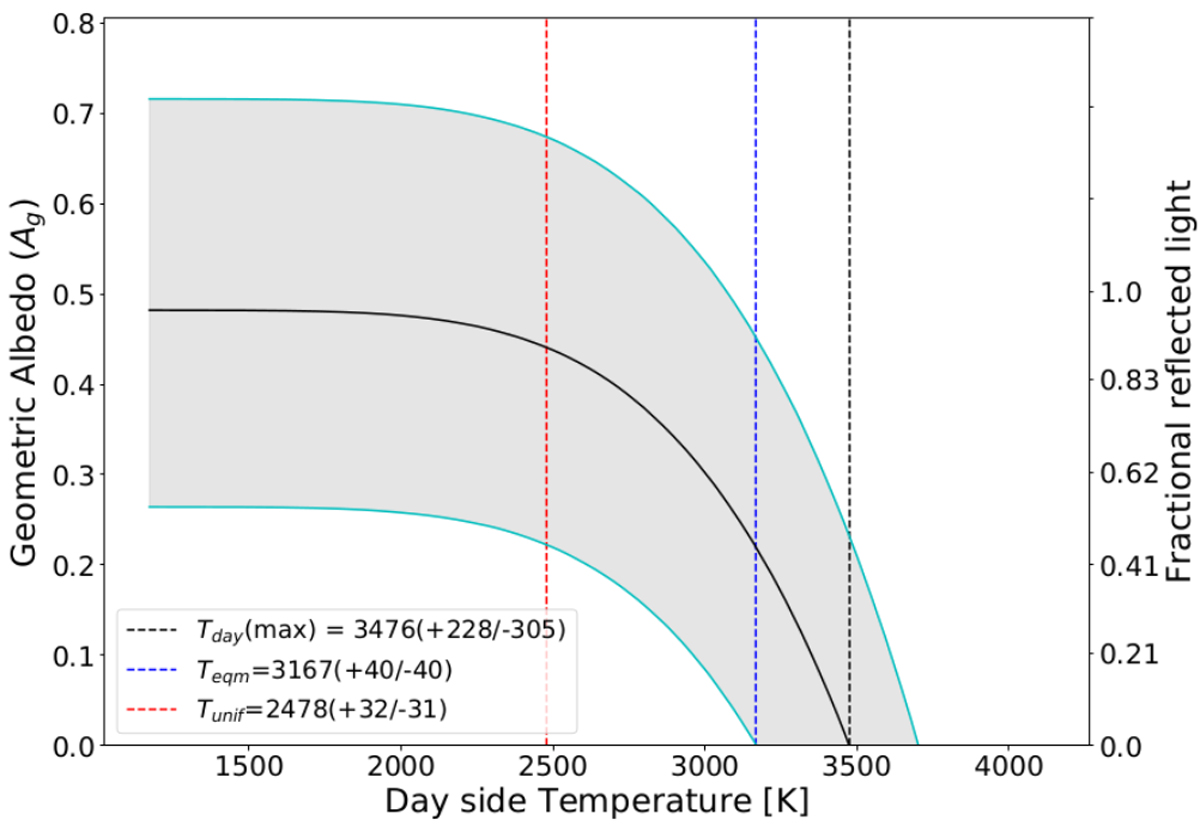
Geometric albedo vs day-side temperature. The dashed lines correspond to the maximum planet day-side temperature (black), the equilibrium temperature in the no-albedo and no-circulation limit (blue) and the uniform temperature for a null Bond albedo and extreme heat circulation (red). The shaded grey region displays the 1σ interval for the geometric albedo.
Current usage metrics show cumulative count of Article Views (full-text article views including HTML views, PDF and ePub downloads, according to the available data) and Abstracts Views on Vision4Press platform.
Data correspond to usage on the plateform after 2015. The current usage metrics is available 48-96 hours after online publication and is updated daily on week days.
Initial download of the metrics may take a while.