Fig. 5
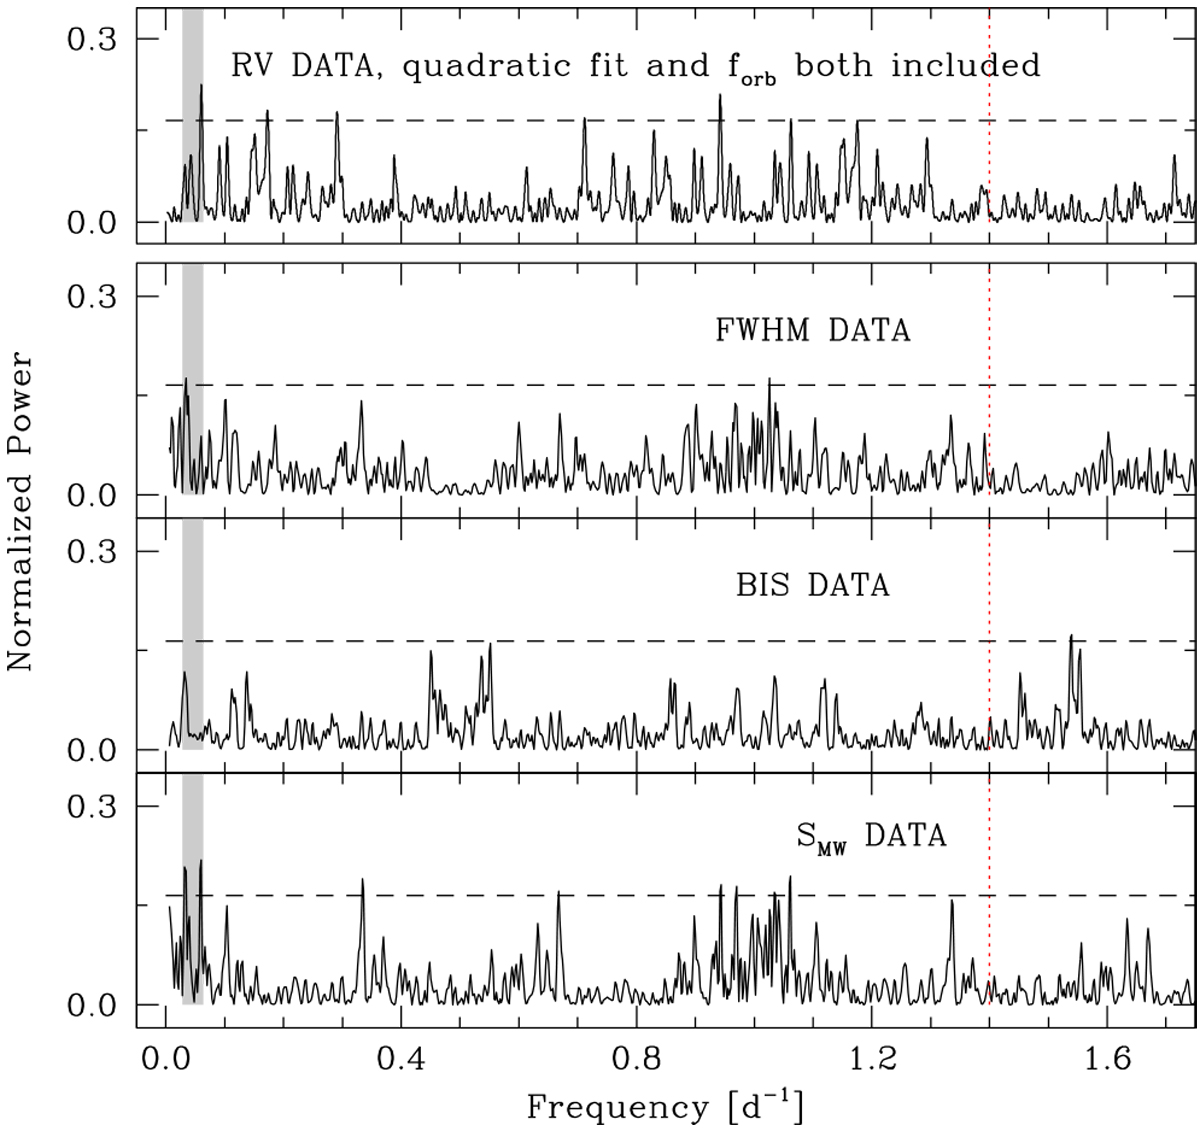
Top to bottom: ISW power spectra of the RV (long-term trend and orbital frequency considered as known constituents), FWHM, BIS, SMW (no known constituent) timeseries. The vertical red line indicates the orbital period of the transiting planet. The grey region at low frequencies delimits the interval where the rotational frequency is expected from the K2 photometry. The horizontal lines mark the 1% FAP.
Current usage metrics show cumulative count of Article Views (full-text article views including HTML views, PDF and ePub downloads, according to the available data) and Abstracts Views on Vision4Press platform.
Data correspond to usage on the plateform after 2015. The current usage metrics is available 48-96 hours after online publication and is updated daily on week days.
Initial download of the metrics may take a while.