Fig. 11
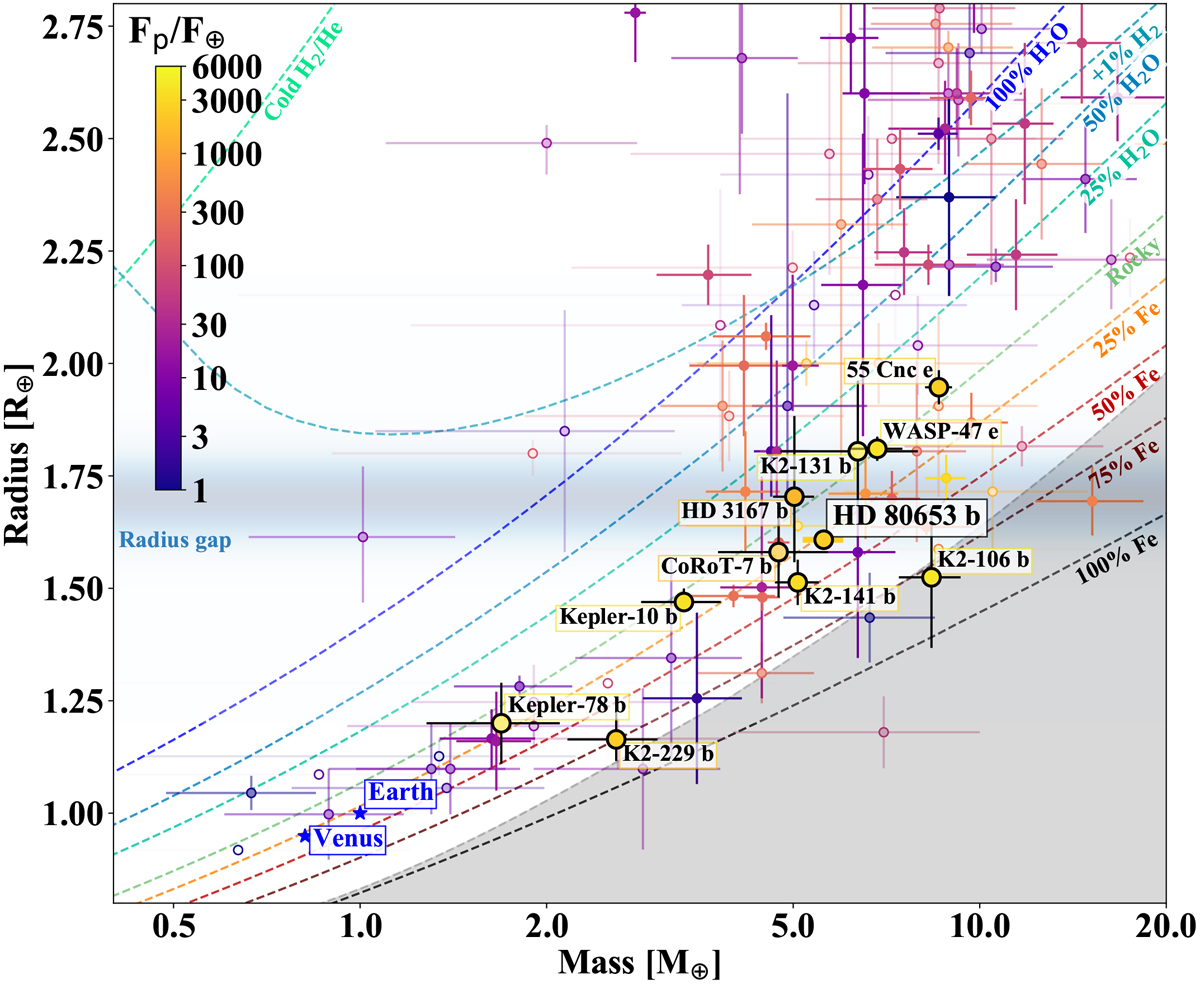
Mass-radius diagram of planets smaller than ~2.8 R⊕. The data points are shaded according to the precision on the mass, with a full color indicating a value better than 20%. Earth and Venus are shown for comparison. The dashed lines show planetary interior models for different compositions as labelled (Zeng et al. 2019). Planets are color-coded according to the incident flux Fp, relative to the solar constant F⊙ The horizontal light-blue shade centered on R ~ 1.70 R⊕ shows the radius Gap. The shaded gray region marks the maximum value of iron content predicted by collisional stripping (Marcus et al. 2010).
Current usage metrics show cumulative count of Article Views (full-text article views including HTML views, PDF and ePub downloads, according to the available data) and Abstracts Views on Vision4Press platform.
Data correspond to usage on the plateform after 2015. The current usage metrics is available 48-96 hours after online publication and is updated daily on week days.
Initial download of the metrics may take a while.