Fig. 1
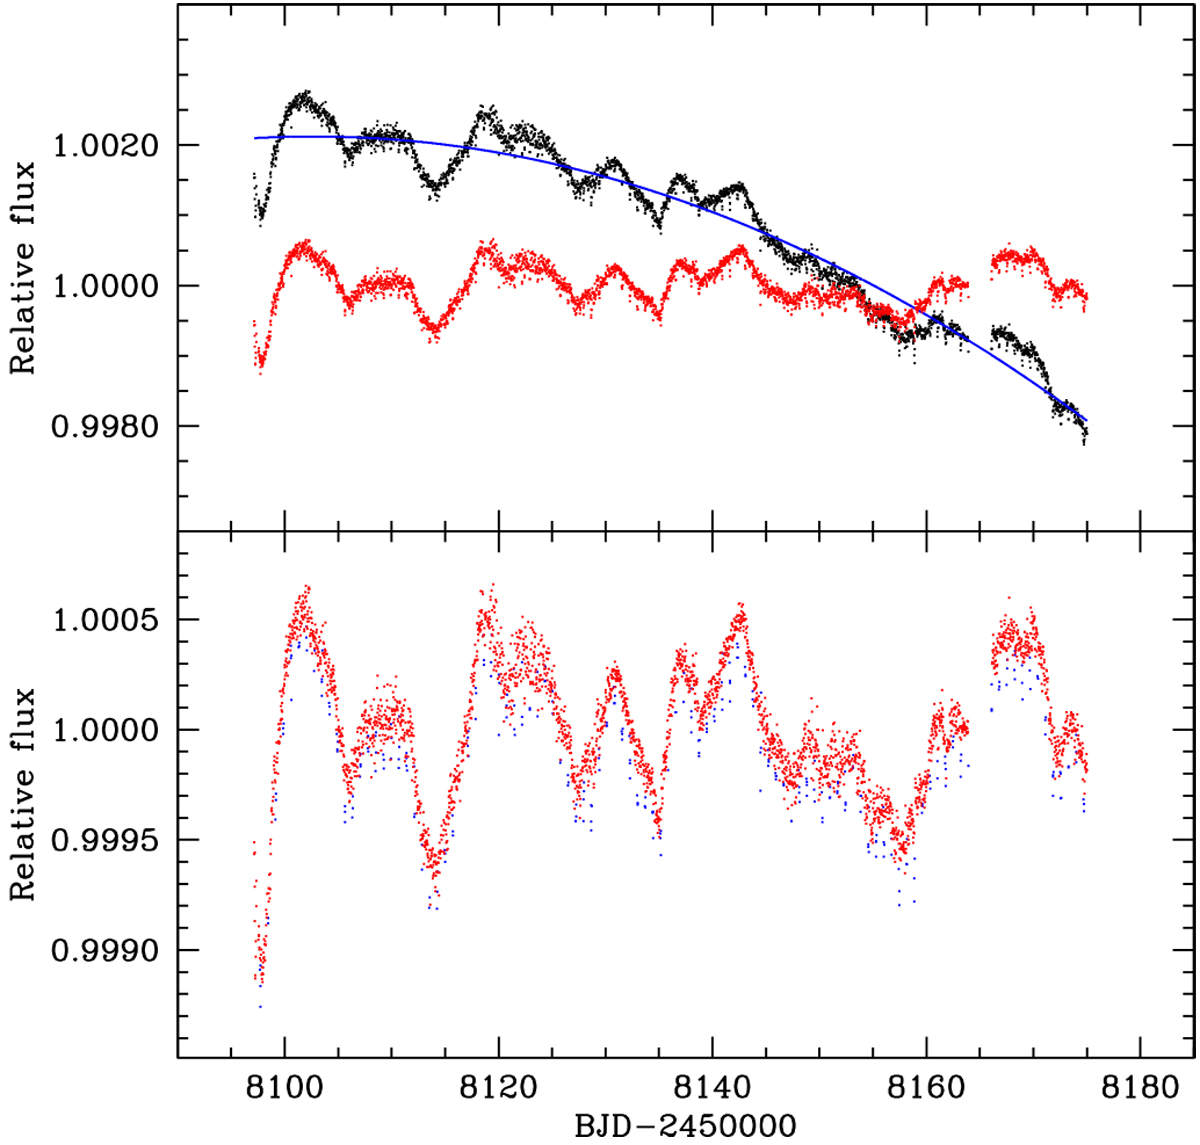
K2 photometry of HD 80653. Top panel: light curve extracted from the MAST raw images (black dots), second-order polynomial fit of the long-term instrumental trend (blue line), corrected light-curve (red dots). Bottom panel: corrected data (red dots) with highlighted measurements obtained during transits (blue dots). Low-frequency flux variations due to the rotational modulation of photospheric active regions are clearly visible.
Current usage metrics show cumulative count of Article Views (full-text article views including HTML views, PDF and ePub downloads, according to the available data) and Abstracts Views on Vision4Press platform.
Data correspond to usage on the plateform after 2015. The current usage metrics is available 48-96 hours after online publication and is updated daily on week days.
Initial download of the metrics may take a while.