Fig. 2.
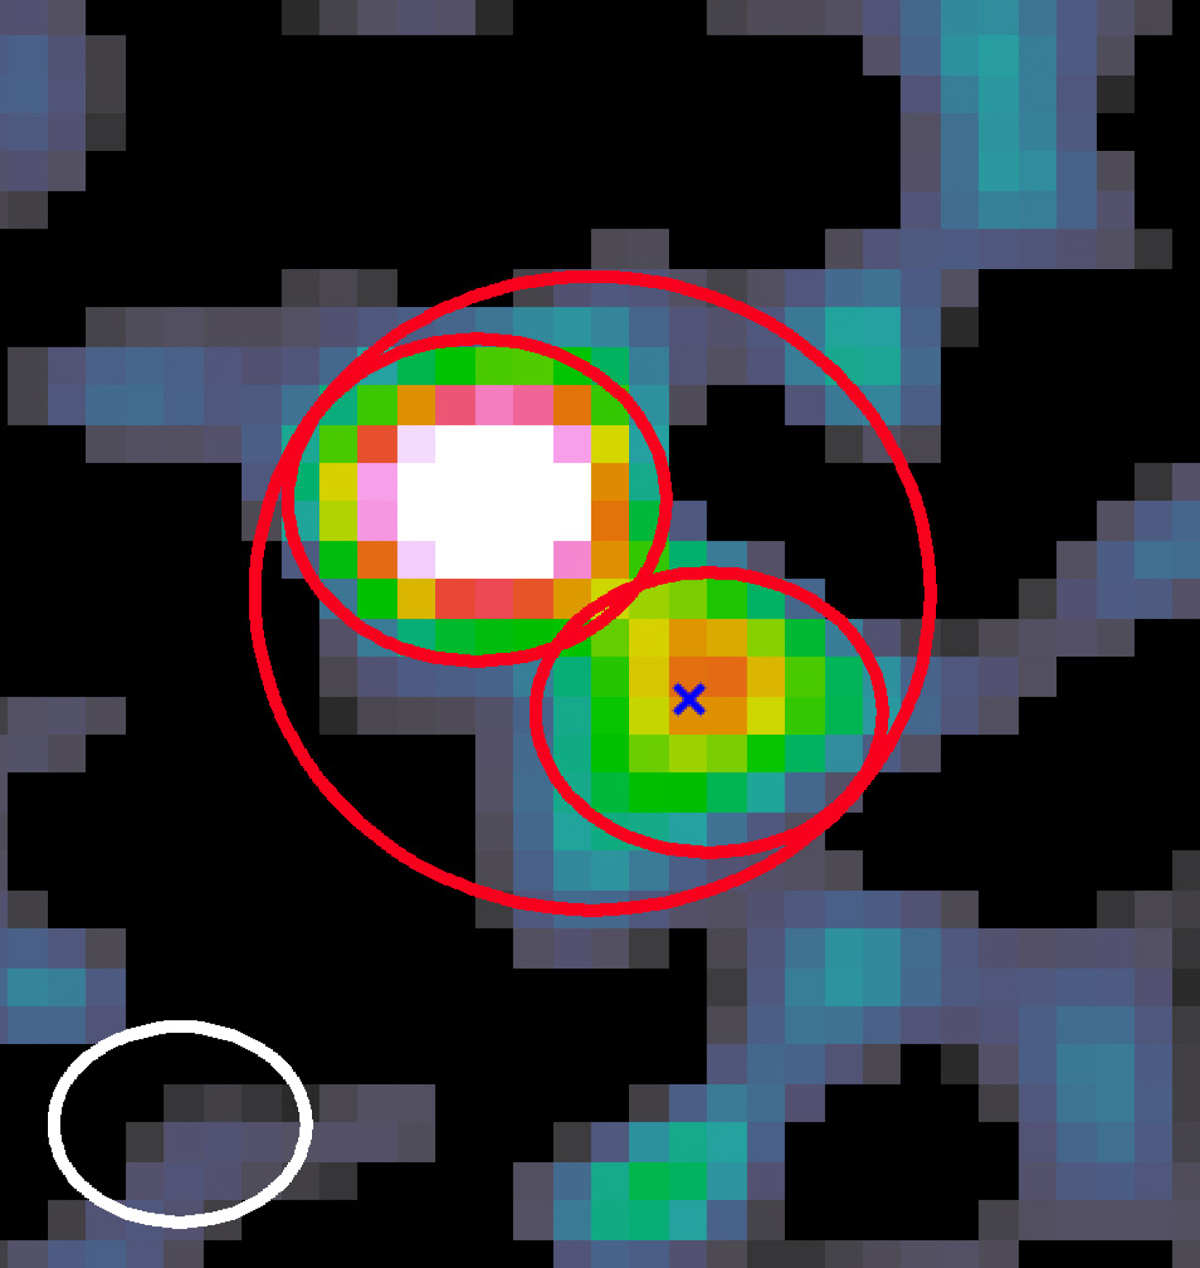
Image of the CO(3-2) emission obtained by ALMA. The spatial resolution (indicated by the white ellipse in the lower left corner) is just enough to resolve the two interacting galaxies. The red elliptical regions indicate the apertures we used to measure the fluxes shown in Table 3. The blue cross indicates the location of the afterglow.
Current usage metrics show cumulative count of Article Views (full-text article views including HTML views, PDF and ePub downloads, according to the available data) and Abstracts Views on Vision4Press platform.
Data correspond to usage on the plateform after 2015. The current usage metrics is available 48-96 hours after online publication and is updated daily on week days.
Initial download of the metrics may take a while.