Fig. 7.
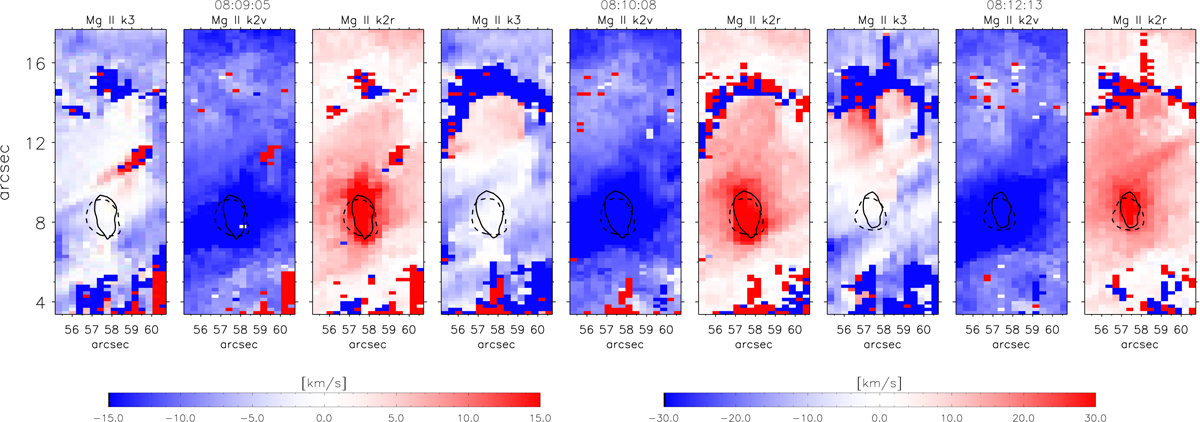
Maps of the Mg II k Doppler shifts for three different time steps. For each time there are three panels representing the shifts with respect to the rest wavelength of the k3, k2v, and k2r features of the Mg II k line. The color table on the left relates to the k3 spectral feature while the color table on the right refers to the k2v and k2r features. The solid black contours delimit the UV burst as seen in the Si IV intensity, while the dashed black contours mark the boundaries of the burst as seen in the Mg II triplet line feature.
Current usage metrics show cumulative count of Article Views (full-text article views including HTML views, PDF and ePub downloads, according to the available data) and Abstracts Views on Vision4Press platform.
Data correspond to usage on the plateform after 2015. The current usage metrics is available 48-96 hours after online publication and is updated daily on week days.
Initial download of the metrics may take a while.