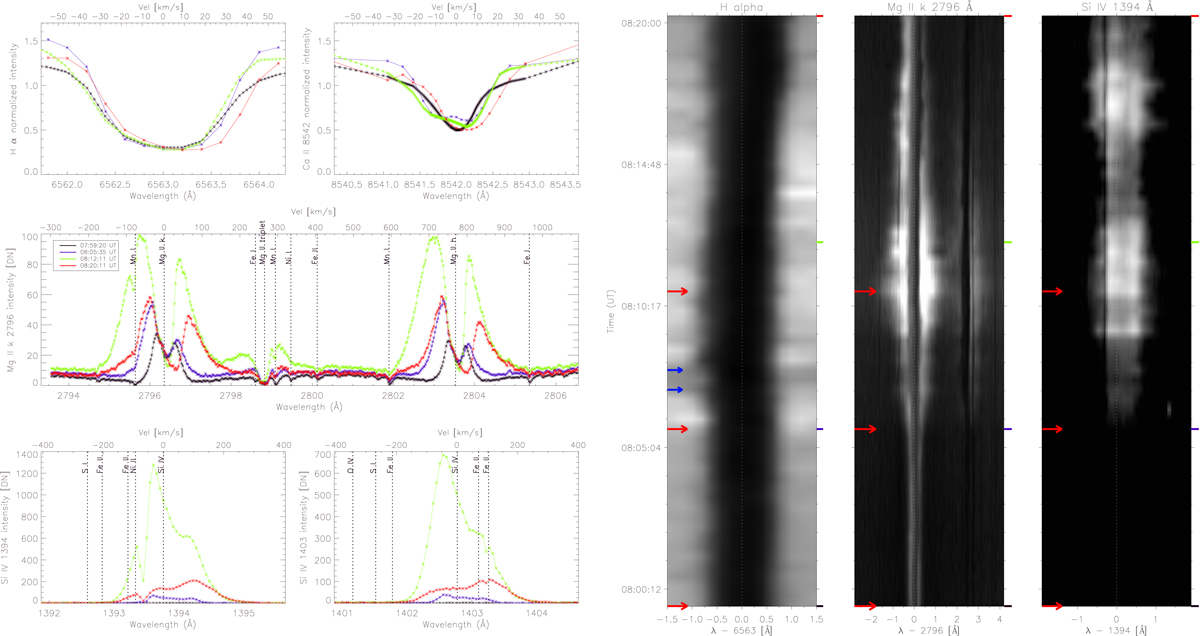
Fig. 3.

Left panel: spectra of different lines for September 6, 2016, at specific times (see legend) during the evolution of the EB and the UV burst. Upper row: H I 656.3 nm and Ca II 854.2 nm respectively; mid row: Mg II k and h lines at 279.6 nm; lower row: Si IV lines at 139.4 and 140.3 nm respectively. The wavelengths at rest of some reference lines are indicated by vertical dotted lines. Right panel: time-sliced spectrum, also for September 6 2016, for H I 656.3 nm (left), Mg II k and triplet lines (center) and the Si IV 139.4 nm line (right). The Ni II absorption line can be seen superimposed on the left wing of Si IV 139.4 nm during the whole duration of the UV brightening. Red and blue arrows mark specific moments in the evolution of the brightenings (see text for details). The colored marks pinpoint to the same times that have been highlighted in the left panel. We have applied a gamma adjustment to the Si IV color table.
Current usage metrics show cumulative count of Article Views (full-text article views including HTML views, PDF and ePub downloads, according to the available data) and Abstracts Views on Vision4Press platform.
Data correspond to usage on the plateform after 2015. The current usage metrics is available 48-96 hours after online publication and is updated daily on week days.
Initial download of the metrics may take a while.


