Fig. 2.
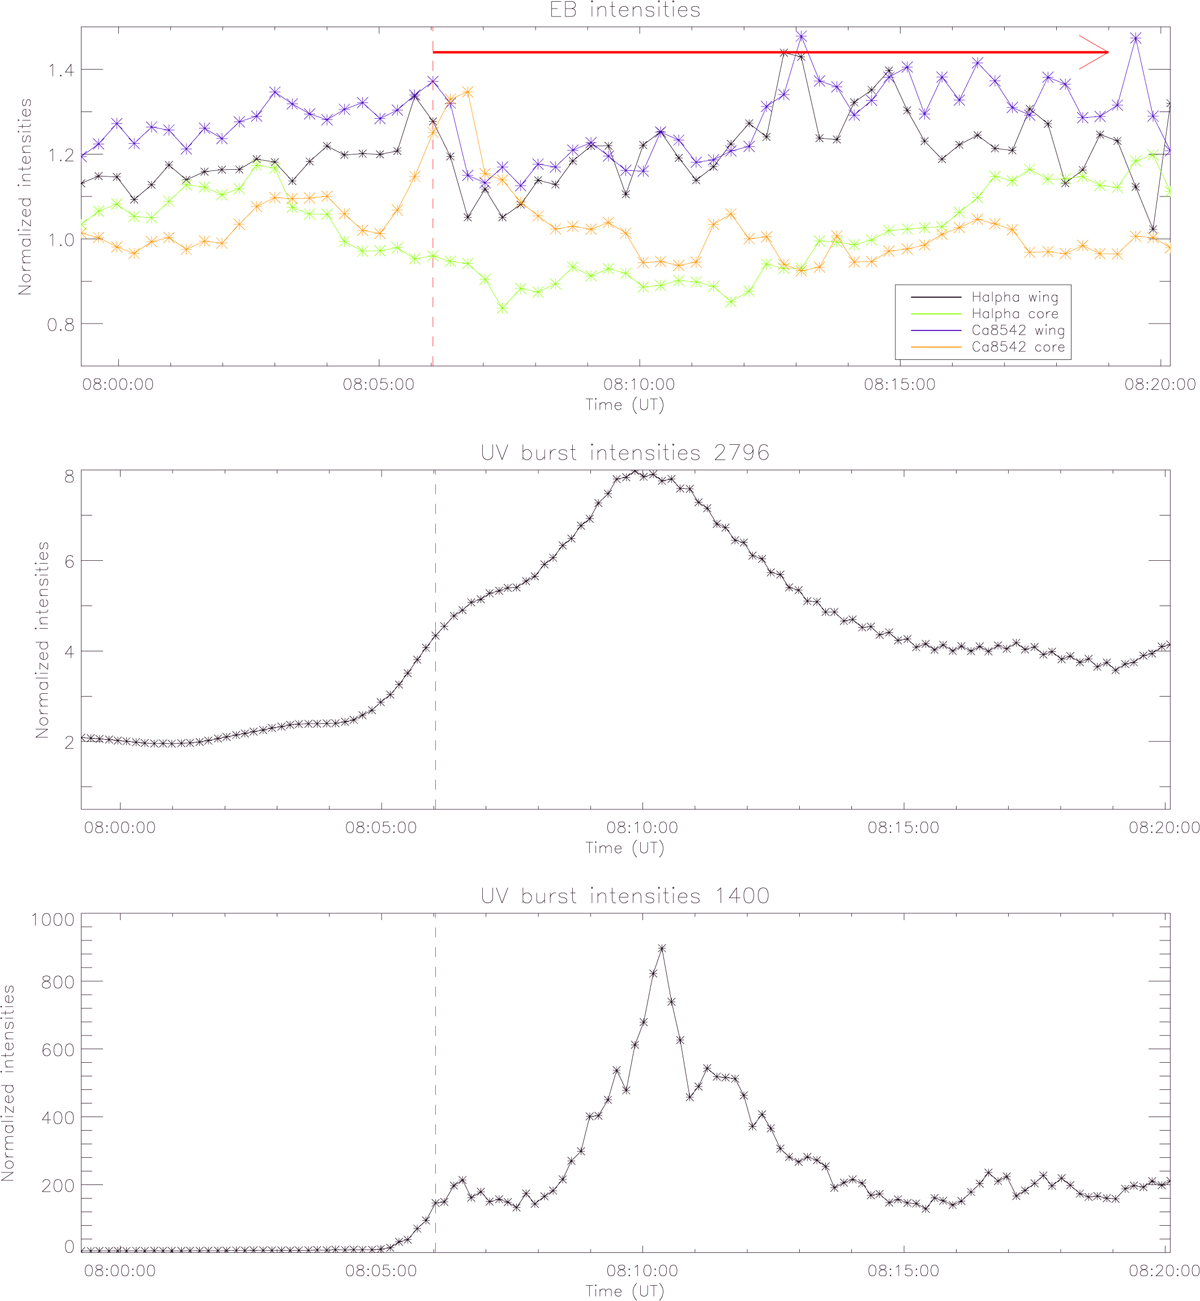
Intensity as a function of time during the duration of the co-spatial and co-temporal EB and UV burst brightenings for September 6, 2016. Upper panel: average SST Hα (wing and core, black and green respectively) and Ca II 854.2 nm (wing and core, blue and orange respectively) intensities in a box enclosing the EB. Middle panel: average IRIS SJI 279.6 nm intensity in a box enclosing the UV burst. Lower panel: average IRIS SJI 140 nm intensity in a box enclosing the UV burst. The vertical dashed line and the red arrow mark the onset and lifetime of the surge.
Current usage metrics show cumulative count of Article Views (full-text article views including HTML views, PDF and ePub downloads, according to the available data) and Abstracts Views on Vision4Press platform.
Data correspond to usage on the plateform after 2015. The current usage metrics is available 48-96 hours after online publication and is updated daily on week days.
Initial download of the metrics may take a while.