Fig. 12.
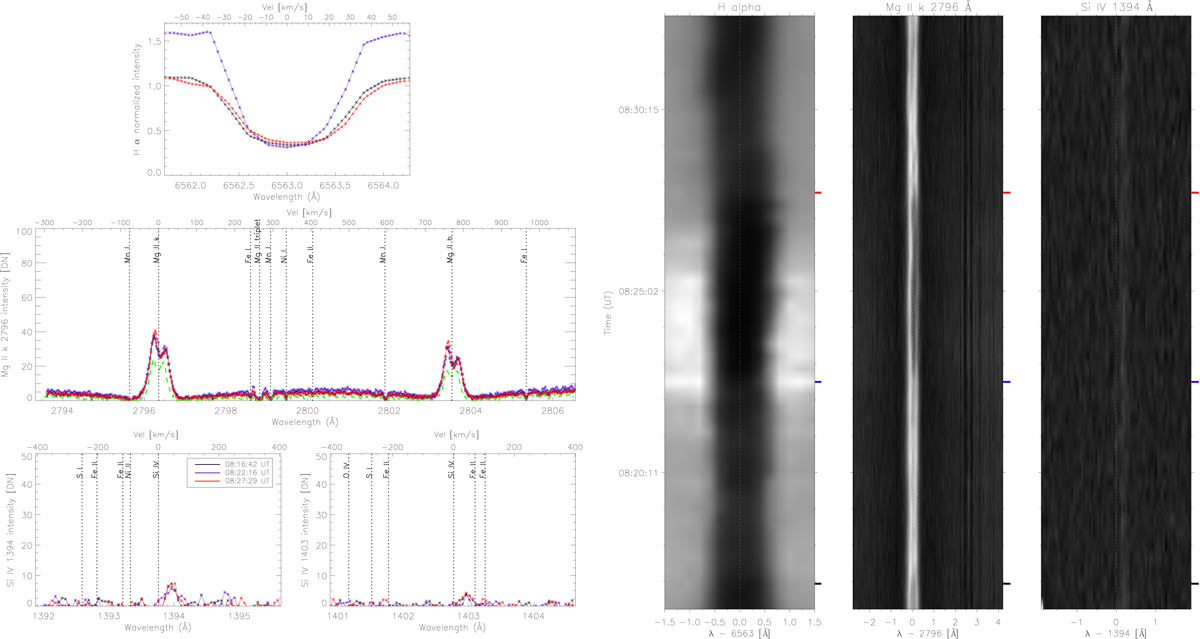
Same as Fig. 3 but for September 5, 2016. No UV burst was found associated with this particular EB. The dashed green curve in the Mg II panel shows a quiet Sun profile for reference: barely any imprint from the EB is observed in the Mg II spectra. The colored marks in the time-sliced spectra pinpoint to the same times that have been highlighted in the left panel.
Current usage metrics show cumulative count of Article Views (full-text article views including HTML views, PDF and ePub downloads, according to the available data) and Abstracts Views on Vision4Press platform.
Data correspond to usage on the plateform after 2015. The current usage metrics is available 48-96 hours after online publication and is updated daily on week days.
Initial download of the metrics may take a while.