Fig. C.1.
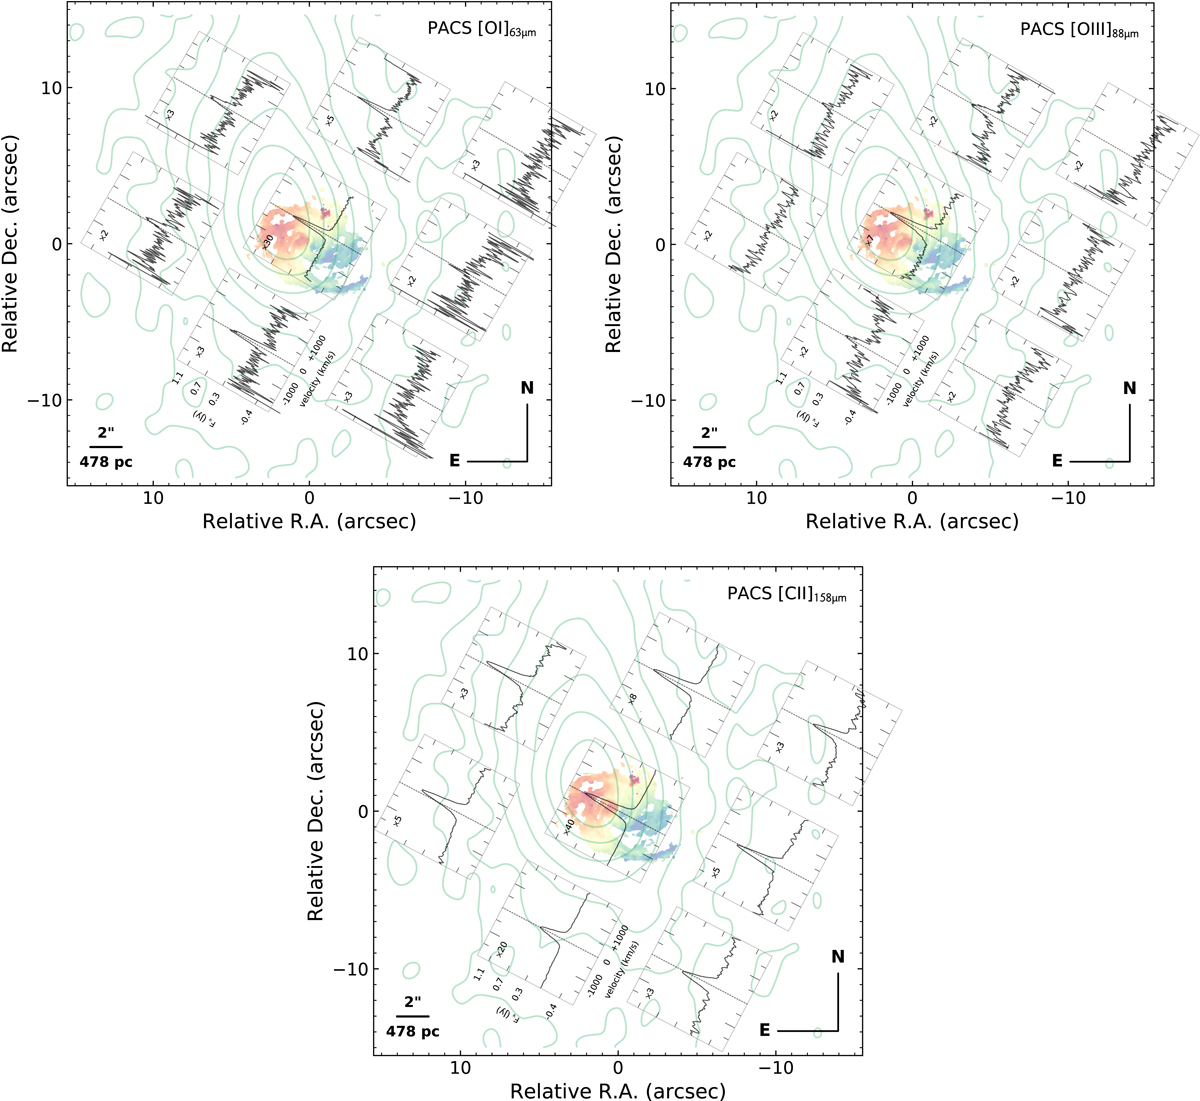
ALMA CO(2-1) mean velocity map is compared to the extended [O III]5007 Å line emission (green contours), the Herschel/PACS IFU spectra for the [O I]63 μm far-IR fine-structure line (square insets in the upper left panel), the [O III]88μm line (upper right panel), and the [C II]158μm line (lower panel). The optical datacube was taken from the Siding Spring Southern Seyfert Spectroscopic Snapshot Survey (Thomas et al. 2017) and was aligned to the ALMA data assuming that the peak of the stellar optical continuum coincides with the unresolved 1.2 mm radio core. As shown by Thomas et al. (2017), the [O III]5007 Å emission morphology is asymmetric and extended along PA ∼30°. Note the lower angular resolution of the PACS data (![]() per spaxel element, only the central and neighbouring elements from the 5 × 5 array are shown here. [O I]63 μm, [O III]88 μm, and [C II]158 μm fluxes are in Jy (see scale in the left inset panel of the middle row), normalised to the value indicated in the upper left corner of each frame, to facilitate the comparison among different frames.
per spaxel element, only the central and neighbouring elements from the 5 × 5 array are shown here. [O I]63 μm, [O III]88 μm, and [C II]158 μm fluxes are in Jy (see scale in the left inset panel of the middle row), normalised to the value indicated in the upper left corner of each frame, to facilitate the comparison among different frames.
Current usage metrics show cumulative count of Article Views (full-text article views including HTML views, PDF and ePub downloads, according to the available data) and Abstracts Views on Vision4Press platform.
Data correspond to usage on the plateform after 2015. The current usage metrics is available 48-96 hours after online publication and is updated daily on week days.
Initial download of the metrics may take a while.