Fig. 6.
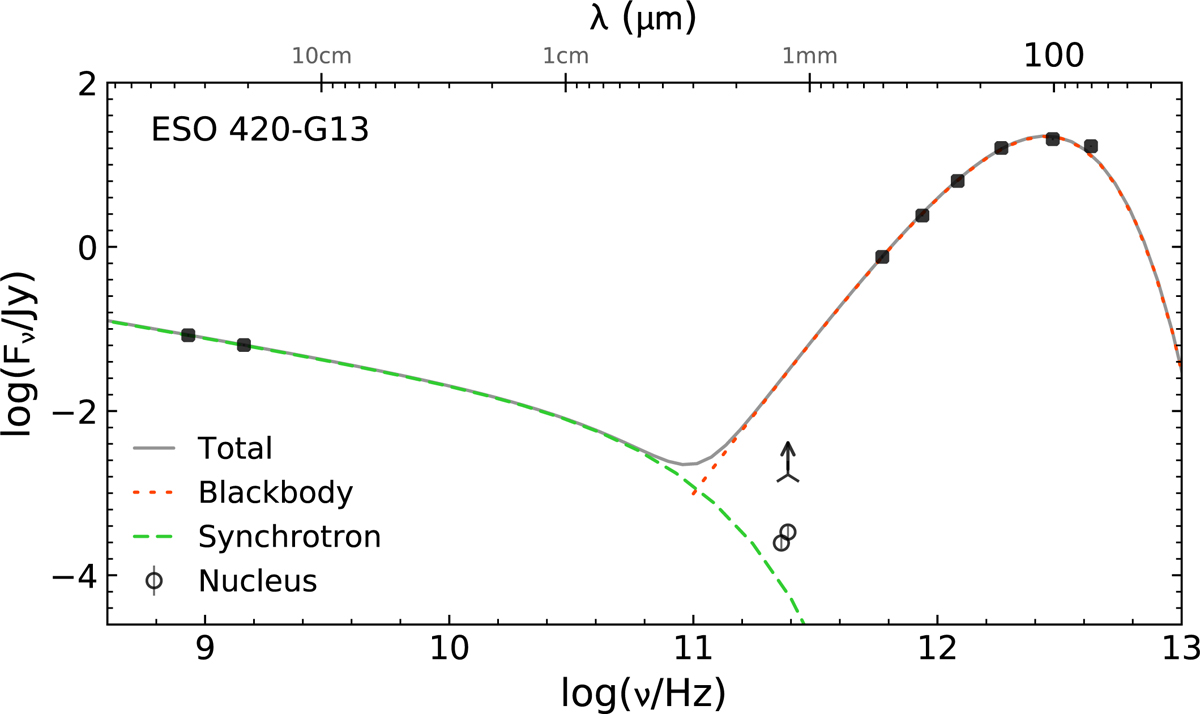
Flux distribution of the radio-to-IR continuum emission for ESO 420-G13 compiled from the literature (black circles). Our ALMA continuum measurements at 227 GHz and 241 GHz for the nuclear point-like source (![]() ) are represented by open circles, and the total integrated flux within the inner 27″ at 241 GHz is represented as a lower limit because of the possible spatial filtering of flux extended over spatial scales larger than
) are represented by open circles, and the total integrated flux within the inner 27″ at 241 GHz is represented as a lower limit because of the possible spatial filtering of flux extended over spatial scales larger than ![]() in the interferometric observations (see Table A.1). The model including synchrotron continuum (dashed green line) and black body emission (dotted orange line) has been fitted to the flux distribution (solid grey line). Flux errors do not appear in the figure because their sizes are smaller than the symbols in the plot.
in the interferometric observations (see Table A.1). The model including synchrotron continuum (dashed green line) and black body emission (dotted orange line) has been fitted to the flux distribution (solid grey line). Flux errors do not appear in the figure because their sizes are smaller than the symbols in the plot.
Current usage metrics show cumulative count of Article Views (full-text article views including HTML views, PDF and ePub downloads, according to the available data) and Abstracts Views on Vision4Press platform.
Data correspond to usage on the plateform after 2015. The current usage metrics is available 48-96 hours after online publication and is updated daily on week days.
Initial download of the metrics may take a while.