Fig. 5.
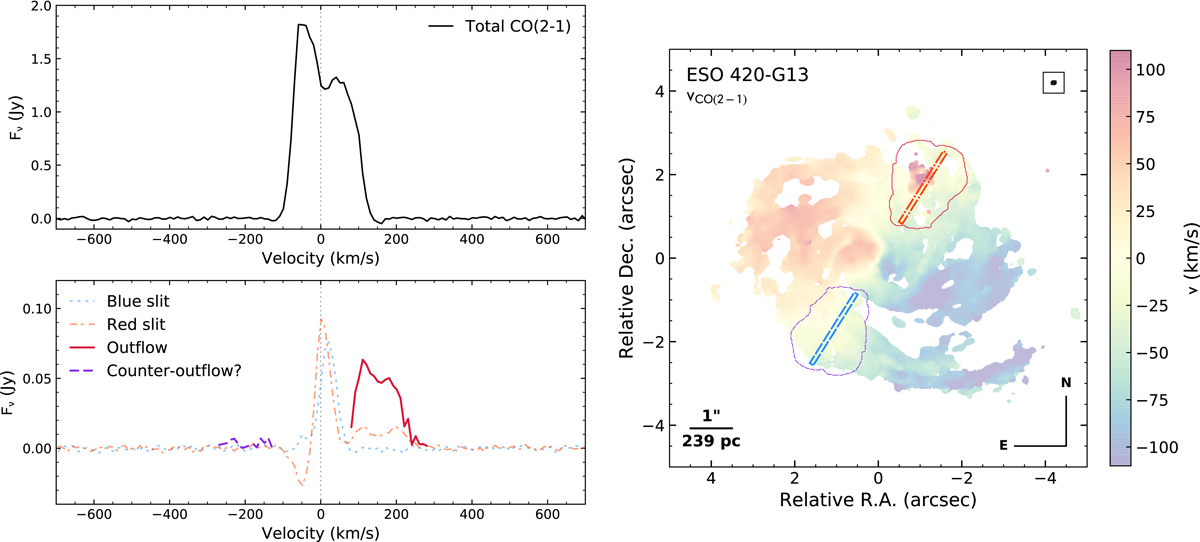
Upper left: spectrum of the total integrated CO(2–1) emission for ESO 420-G13. Bottom left: spectra of the integrated flux for two pseudo-slits extracted along the kinematic minor axis, one intersecting the outflow (1″ < Δx < 3″, orange dot-dashed line) and one in the opposite direction (−3″ < Δx < −1″, dotted blue line). The CO(2–1) flux extracted from a 3D mask applied to the ALMA datacube allows us to isolate the outflow emission (solid red line) from the rotating gas. A symmetric mask located south-east of the nucleus at blueshifted velocities has also been applied, although no counter-outflow is detected in the integrated spectrum (dashed purple line). The negative amplitudes at ∼−70 km s−1 are produced by interferometric artefacts in the image reconstruction process. Right: pseudo-slit positions (dashed blue and dot-dashed orange rectangles) and the projections of the outflow mask (solid red contour) and the counter-outflow mask (dashed purple contour) are indicated in the mean velocity map.
Current usage metrics show cumulative count of Article Views (full-text article views including HTML views, PDF and ePub downloads, according to the available data) and Abstracts Views on Vision4Press platform.
Data correspond to usage on the plateform after 2015. The current usage metrics is available 48-96 hours after online publication and is updated daily on week days.
Initial download of the metrics may take a while.