Fig. 4.
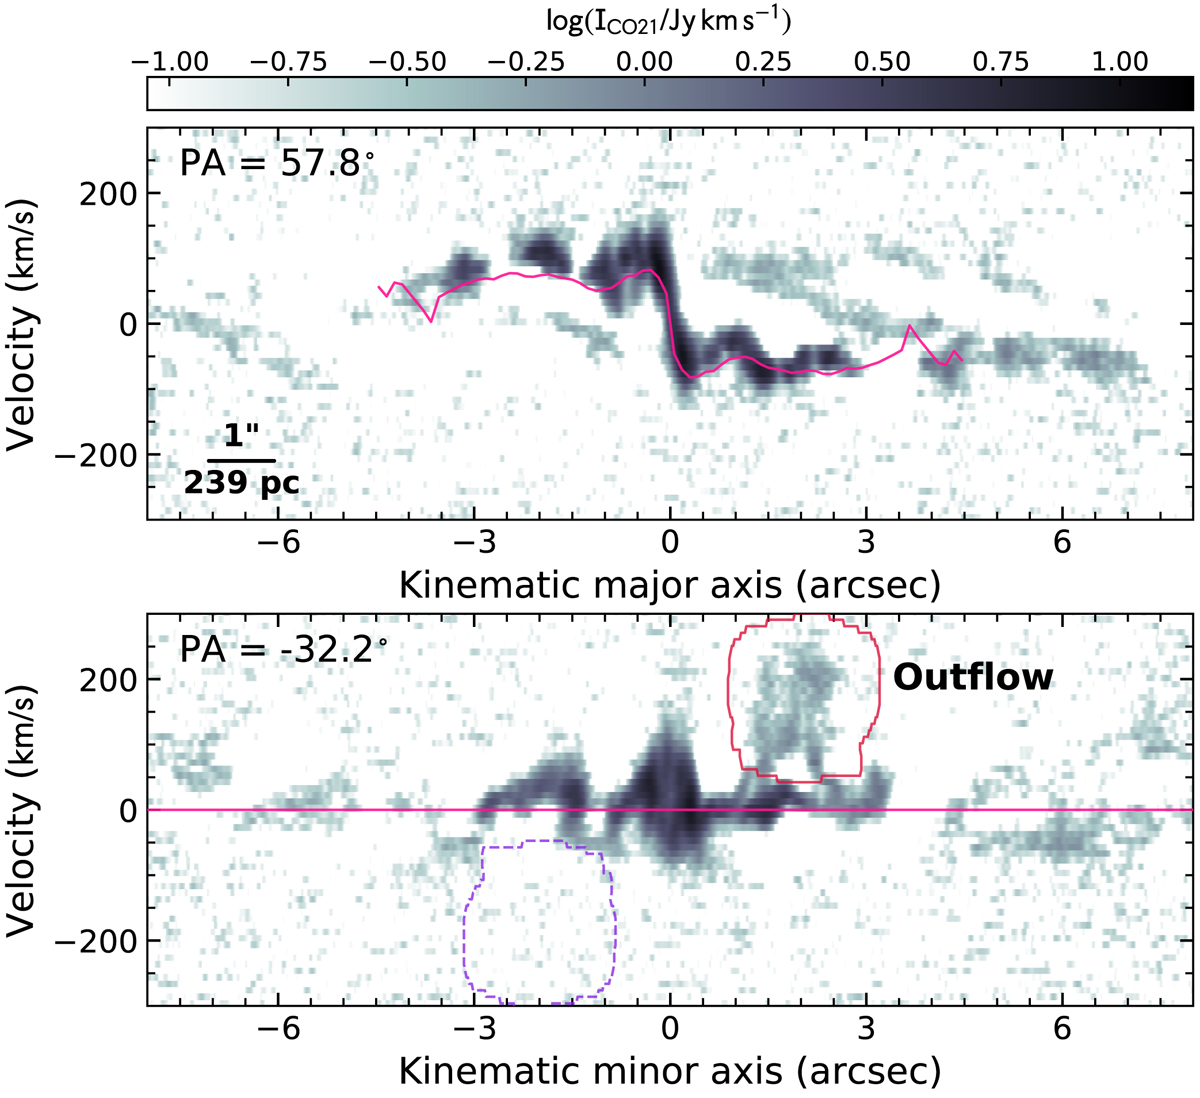
Top: position-velocity diagram along the kinematic major axis (PA ![]() ). The magenta line indicates the best-fit circular rotation curve obtained with DISKFIT. Bottom: position-velocity diagram along the kinematic minor axis (PA
). The magenta line indicates the best-fit circular rotation curve obtained with DISKFIT. Bottom: position-velocity diagram along the kinematic minor axis (PA ![]() ). The magenta horizontal line indicates the best-fit systemic velocity of the galaxy (3568 ± 7 km s−1). The solid red and dashed purple contours delineate the section of the 3D mask we used to integrate the outflow region and its symmetric region across the kinematic minor axis, respectively.
). The magenta horizontal line indicates the best-fit systemic velocity of the galaxy (3568 ± 7 km s−1). The solid red and dashed purple contours delineate the section of the 3D mask we used to integrate the outflow region and its symmetric region across the kinematic minor axis, respectively.
Current usage metrics show cumulative count of Article Views (full-text article views including HTML views, PDF and ePub downloads, according to the available data) and Abstracts Views on Vision4Press platform.
Data correspond to usage on the plateform after 2015. The current usage metrics is available 48-96 hours after online publication and is updated daily on week days.
Initial download of the metrics may take a while.