Fig. 3.
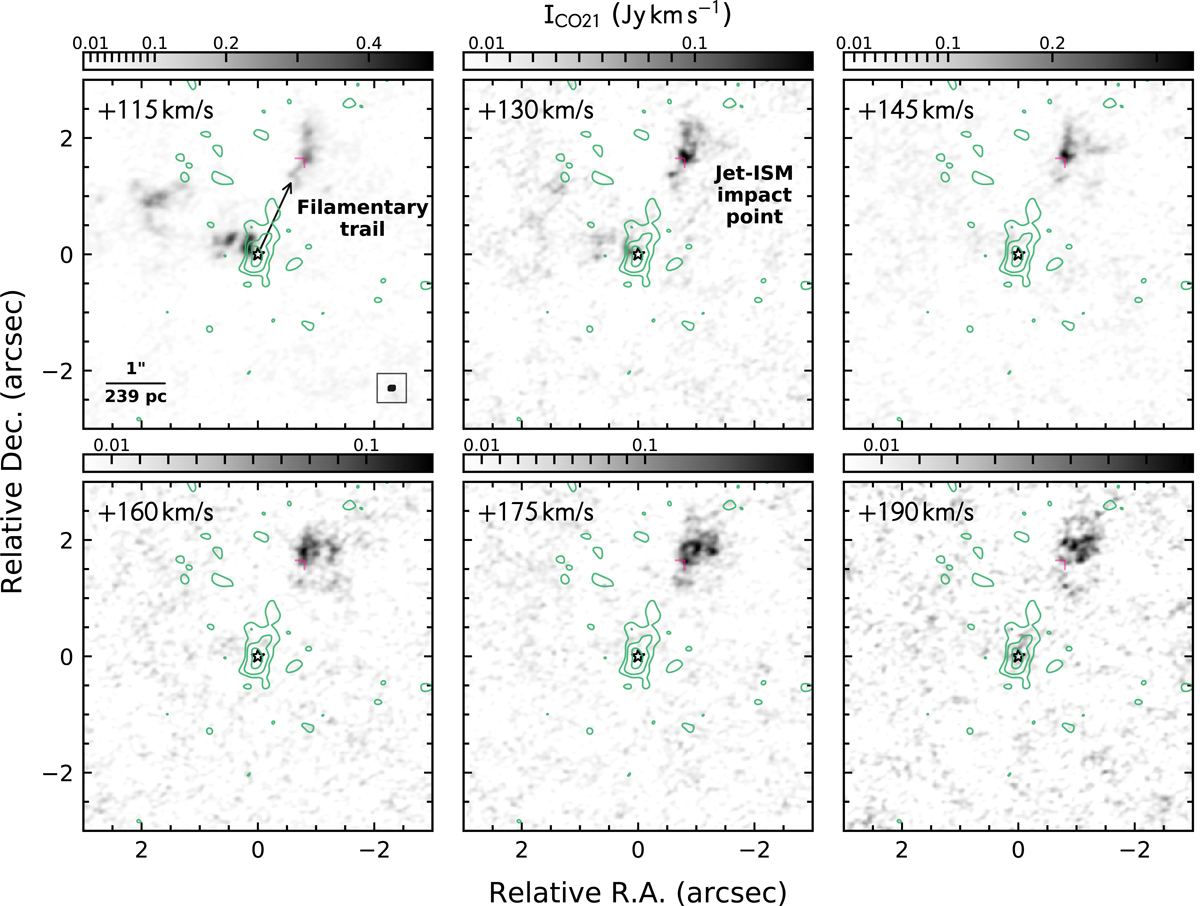
CO(2–1) channel maps from +115 km s−1 to +190 km s−1 (step of 15 km s−1; projected velocities) relative to a systemic velocity of vsys = 3568 ± 7 km s−1 (this work). A complex filamentary emission in a gradually denser ISM is revealed within the outflowing wind, starting with a diffuse emission trail at ![]() ,
, ![]() (black arrow; projected distance of 340 pc from the AGN) followed by a jet-ISM impact point at
(black arrow; projected distance of 340 pc from the AGN) followed by a jet-ISM impact point at ![]() ,
, ![]() (pink marker; projected 440 pc). After the bifurcation, the wind expands and develops a cone-like structure where the highest velocities are found along its central axis. The solid green contours correspond to the integrated [Ne II]12.8μm emission from VLT/VISIR (starting from 3× RMS with a spacing of ×10N/4). The black star indicates the position of the AGN in the 1.2 mm continuum map. The synthesised beam size is shown in the lower right corner of the first panel.
(pink marker; projected 440 pc). After the bifurcation, the wind expands and develops a cone-like structure where the highest velocities are found along its central axis. The solid green contours correspond to the integrated [Ne II]12.8μm emission from VLT/VISIR (starting from 3× RMS with a spacing of ×10N/4). The black star indicates the position of the AGN in the 1.2 mm continuum map. The synthesised beam size is shown in the lower right corner of the first panel.
Current usage metrics show cumulative count of Article Views (full-text article views including HTML views, PDF and ePub downloads, according to the available data) and Abstracts Views on Vision4Press platform.
Data correspond to usage on the plateform after 2015. The current usage metrics is available 48-96 hours after online publication and is updated daily on week days.
Initial download of the metrics may take a while.