Fig. 2.
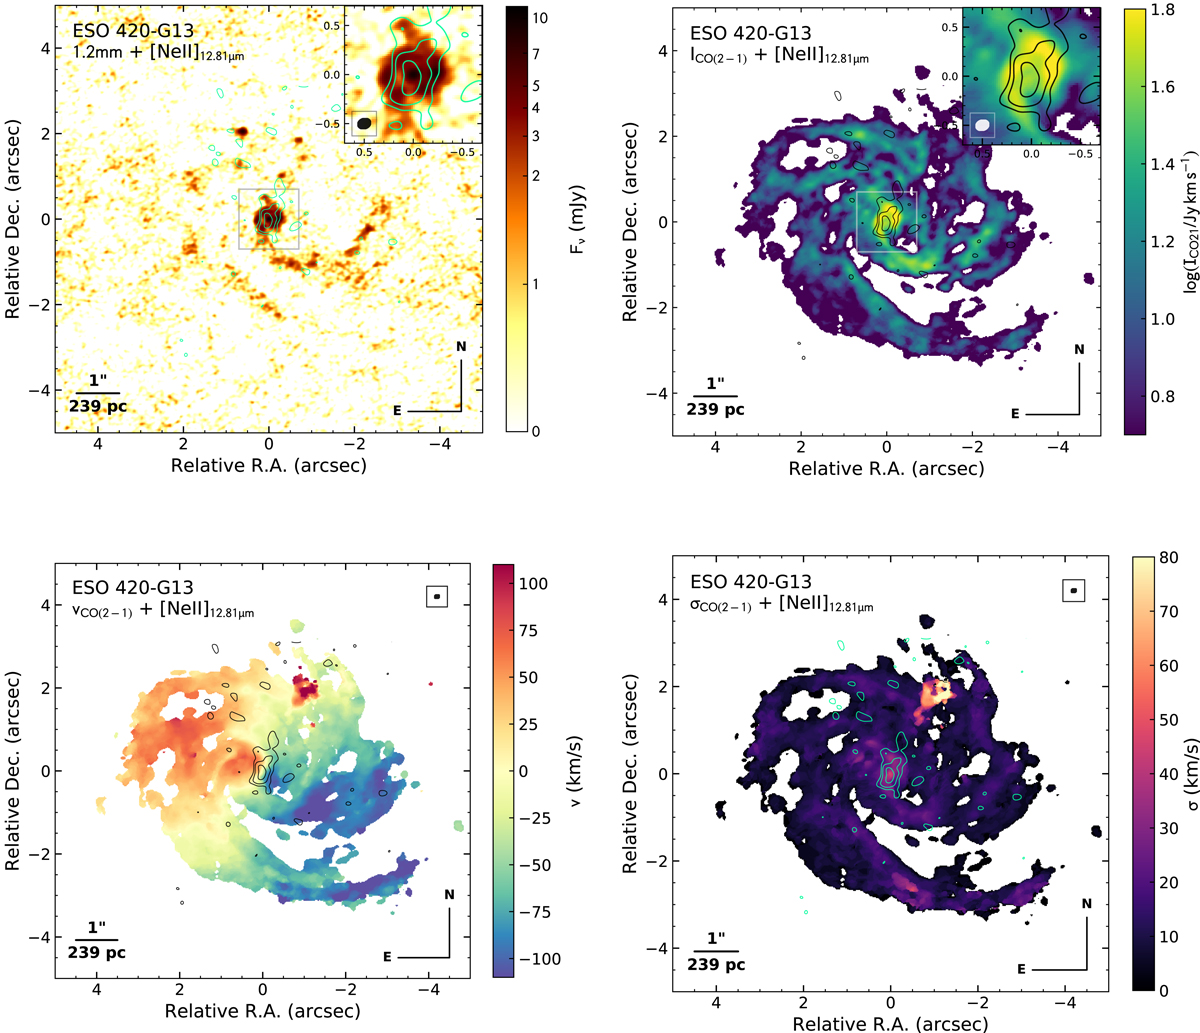
ALMA maps of the 1.2 mm continuum (upper left), CO(2–1) intensity (upper right), CO(2–1) average velocity (lower left), and CO(2–1) average velocity dispersion (lower right) for the Seyfert 2 galaxy ESO 420-G13. The zoomed inset panels correspond to the grey square regions indicated in the corresponding maps. Contours in all panels correspond to the [Ne II]12.8μm line emission from VLT/VISIR (starting from 3× RMS with a spacing of ×10N/4). Assuming trailing spiral arms implies that the south-east extreme of the kinematic minor axis is the nearest point to us. The synthesised beam size is shown in the inset panels and in the upper right corner of the lower maps.
Current usage metrics show cumulative count of Article Views (full-text article views including HTML views, PDF and ePub downloads, according to the available data) and Abstracts Views on Vision4Press platform.
Data correspond to usage on the plateform after 2015. The current usage metrics is available 48-96 hours after online publication and is updated daily on week days.
Initial download of the metrics may take a while.