Fig. 8
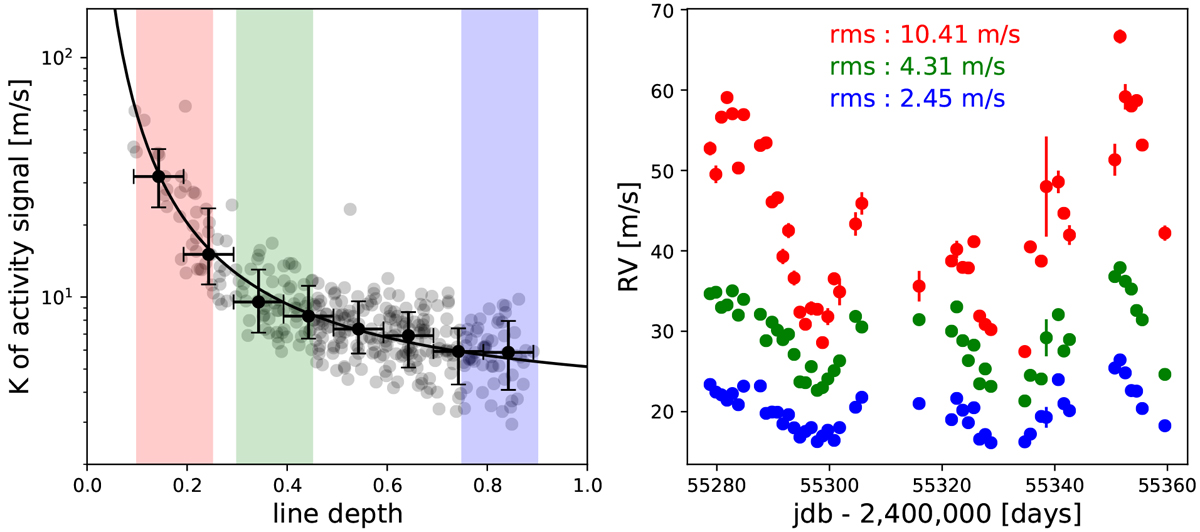
Left:radial velocity semi-amplitude of the stellar activity signal as a function of the line depth d for the correlated symmetric-unblended lines (grey dots). The data are binned into nine bins of size 0.1 (black dots), and the best fit for a second-order polynomial in 1∕d is shown by the black line. Right: radial velocity of the subselections of lines falling in the area of the left plot panel. The RV amplitude grows from strong (blue) to shallow (red) lines.
Current usage metrics show cumulative count of Article Views (full-text article views including HTML views, PDF and ePub downloads, according to the available data) and Abstracts Views on Vision4Press platform.
Data correspond to usage on the plateform after 2015. The current usage metrics is available 48-96 hours after online publication and is updated daily on week days.
Initial download of the metrics may take a while.