Fig. 6
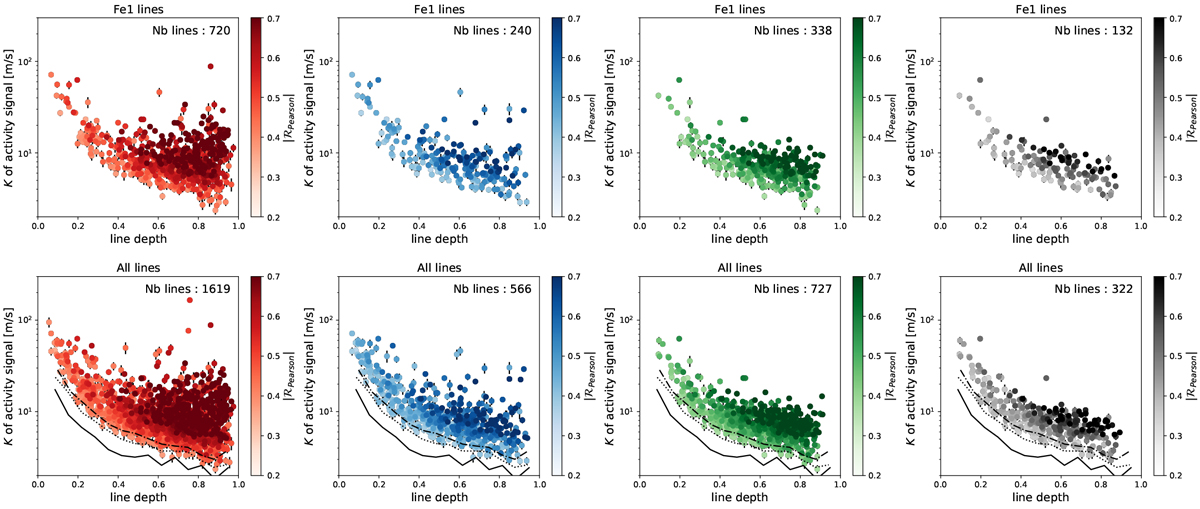
Radial velocity semi-amplitude K induced by stellar activity (K of activity signal defined as the slope of the RVi vs. RVm correlation times the RV semi-amplitude observed in the RVm) as a function of the line depth for our four selection of lines: correlated lines (red dots), unblended (blue dots), symmetric (green dots), and symmetric-unblended (black dots). The colour encodes the Pearson coefficient
![]() . The different curves, from bottom to top, represent the lower envelope of the correlated lines (left bottom panel) taking as threshold
. The different curves, from bottom to top, represent the lower envelope of the correlated lines (left bottom panel) taking as threshold ![]() and 0.4, respectively.Top: Fe I lines. Bottom: all species.
and 0.4, respectively.Top: Fe I lines. Bottom: all species.
Current usage metrics show cumulative count of Article Views (full-text article views including HTML views, PDF and ePub downloads, according to the available data) and Abstracts Views on Vision4Press platform.
Data correspond to usage on the plateform after 2015. The current usage metrics is available 48-96 hours after online publication and is updated daily on week days.
Initial download of the metrics may take a while.