Fig. 5
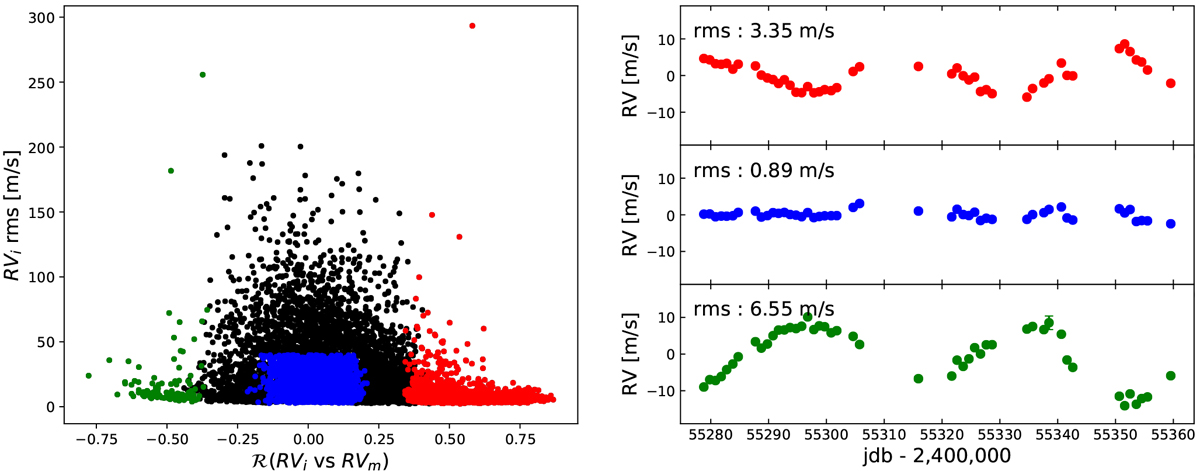
Left: RVi rms as a function of the Pearson correlation coefficient between RVi and RVm (black points). The different colours correspond to the groups defined in Table 1: correlated (red), uncorrelated (blue), and anti-correlated (green). Right: RV time-series obtained by combining the RV information of all the lines in each group defined in Table 1 and shown in the left panel.
Current usage metrics show cumulative count of Article Views (full-text article views including HTML views, PDF and ePub downloads, according to the available data) and Abstracts Views on Vision4Press platform.
Data correspond to usage on the plateform after 2015. The current usage metrics is available 48-96 hours after online publication and is updated daily on week days.
Initial download of the metrics may take a while.