Fig. 4
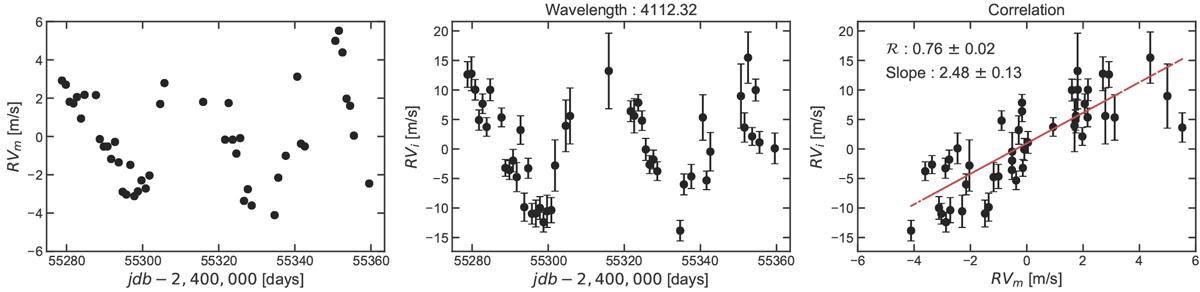
Left panel: detrended one-day binned mean radial velocity RVm of α Cen Bmeasured on all the spectral lines. Uncertainties are displayed, but are too small to be visible. Middle panel: detrended one-day binned individual radial velocity RVi of the Fe I line at 4112.30 Å. Right panel: weighted linear regression between RVi and RVm (red line). The coefficient ![]() as well asthe correlation slope are indicated in the legend. The peak-to-peak variation due to activity is ~10 m s−1 in the RVm and ~30 m s−1 in the RVi of the Fe I line at 4112.32 Å.
as well asthe correlation slope are indicated in the legend. The peak-to-peak variation due to activity is ~10 m s−1 in the RVm and ~30 m s−1 in the RVi of the Fe I line at 4112.32 Å.
Current usage metrics show cumulative count of Article Views (full-text article views including HTML views, PDF and ePub downloads, according to the available data) and Abstracts Views on Vision4Press platform.
Data correspond to usage on the plateform after 2015. The current usage metrics is available 48-96 hours after online publication and is updated daily on week days.
Initial download of the metrics may take a while.