Fig. C.1
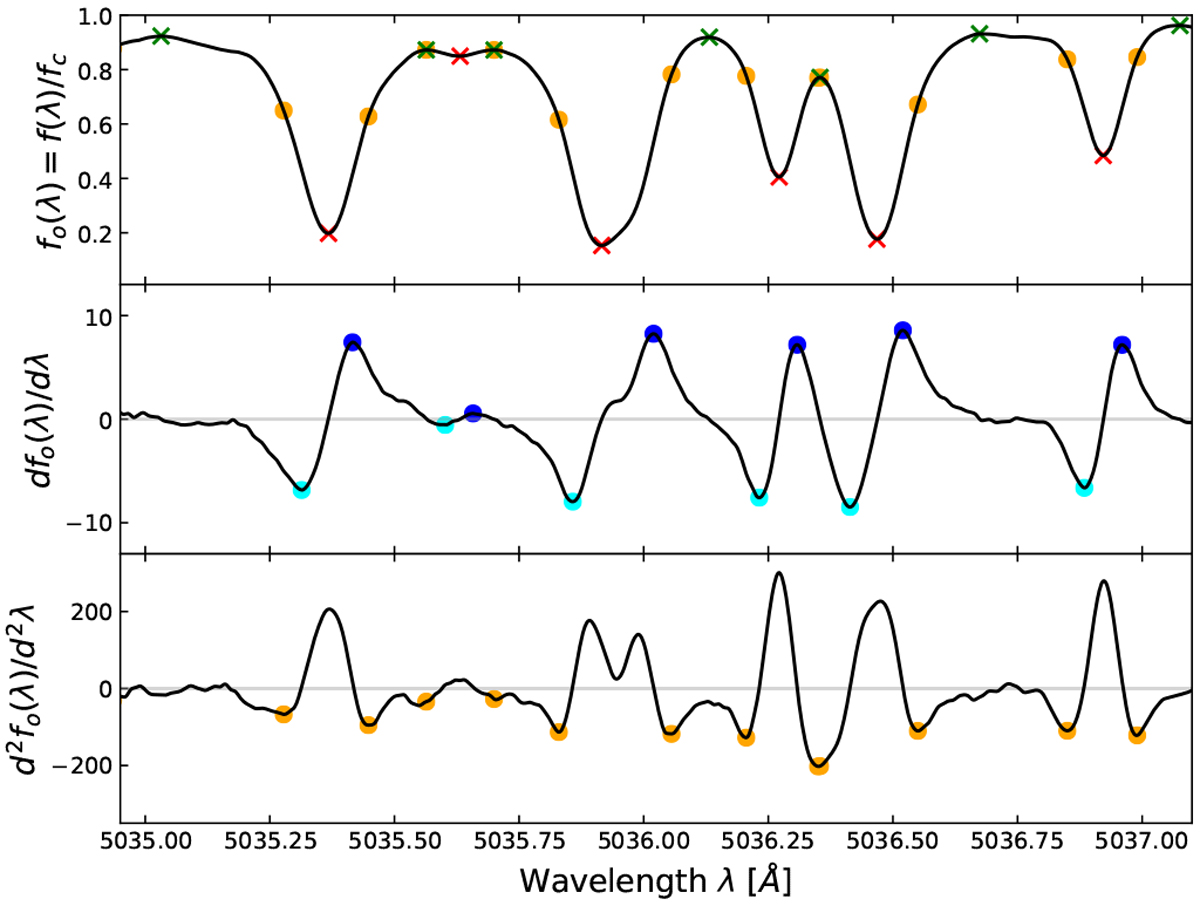
Main points for deriving our morphological parameters. Only the 5035.9 Å line is blended in this case. First row: master quiet spectrum (black curve) was used to derive the line centre (red crosses) as well as the large window (LW) based on the two extrema (green crosses). The points for measuring the asymmetry from the second derivative (bottom panel) are also indicated (orange points). The minimum distance between them and the line centre defines the small window (SW). Second row: first derivative of the flux. The extrema of the derivative are registered on each side of the lines (blue points). Last row: second derivative of the flux. The first negative minima on each side of the lines are registered.
Current usage metrics show cumulative count of Article Views (full-text article views including HTML views, PDF and ePub downloads, according to the available data) and Abstracts Views on Vision4Press platform.
Data correspond to usage on the plateform after 2015. The current usage metrics is available 48-96 hours after online publication and is updated daily on week days.
Initial download of the metrics may take a while.