Fig. B.1
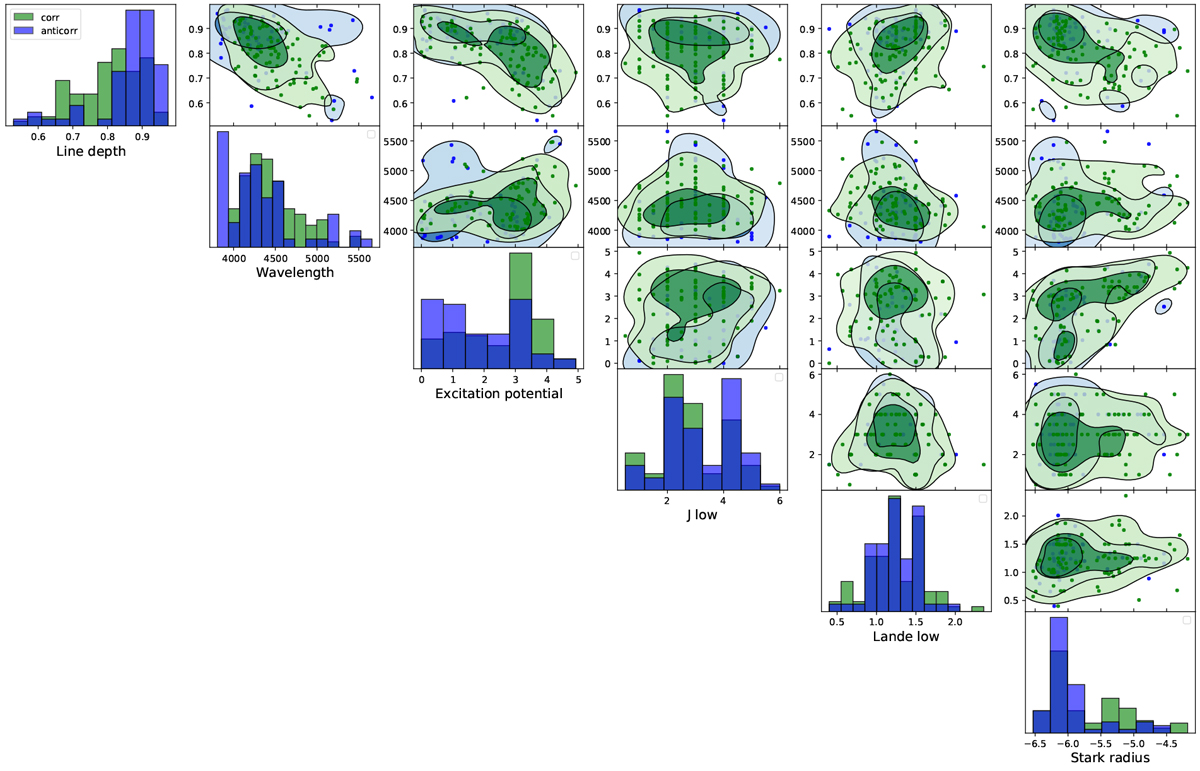
Corner plot of six physical line parameters (line depth, wavelength, excitation potential, angular quantum number Jlow of the lowest energy level, Landé factor (Landé low), and Stark radius) for the correlated (green) and anti-correlated (blue) groups. Kernel density estimates at 1 and 2σ are overplotted. No significant difference is visible between the two groups.
Current usage metrics show cumulative count of Article Views (full-text article views including HTML views, PDF and ePub downloads, according to the available data) and Abstracts Views on Vision4Press platform.
Data correspond to usage on the plateform after 2015. The current usage metrics is available 48-96 hours after online publication and is updated daily on week days.
Initial download of the metrics may take a while.