Fig. 1
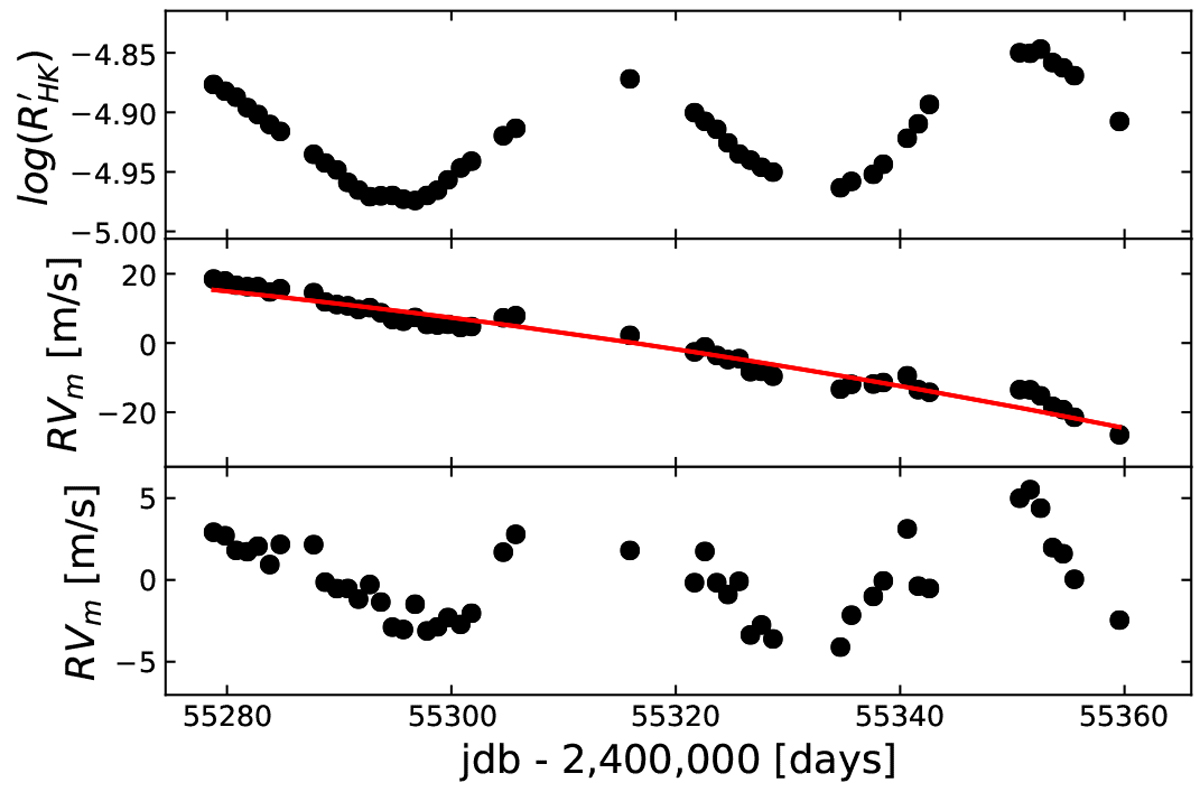
Top: calcium activity index log (![]() ) time series of α Cen B in 2010. The observations span two consecutive rotational phases, where Prot = 35.8 days. Middle: RV time series over the same time interval. We show a quadratic trend fitted to the data (red) that corresponds to the binary contribution of α Cen A and a possible activity cycle (Dumusque 2012). Bottom: RV residuals after removing the quadratic trend, which present an RV rms of 2.1 m s−1. These RV residuals are strongly correlated to the calcium activity index and therefore are significantly affected by stellar activity.
) time series of α Cen B in 2010. The observations span two consecutive rotational phases, where Prot = 35.8 days. Middle: RV time series over the same time interval. We show a quadratic trend fitted to the data (red) that corresponds to the binary contribution of α Cen A and a possible activity cycle (Dumusque 2012). Bottom: RV residuals after removing the quadratic trend, which present an RV rms of 2.1 m s−1. These RV residuals are strongly correlated to the calcium activity index and therefore are significantly affected by stellar activity.
Current usage metrics show cumulative count of Article Views (full-text article views including HTML views, PDF and ePub downloads, according to the available data) and Abstracts Views on Vision4Press platform.
Data correspond to usage on the plateform after 2015. The current usage metrics is available 48-96 hours after online publication and is updated daily on week days.
Initial download of the metrics may take a while.