Fig. 6.
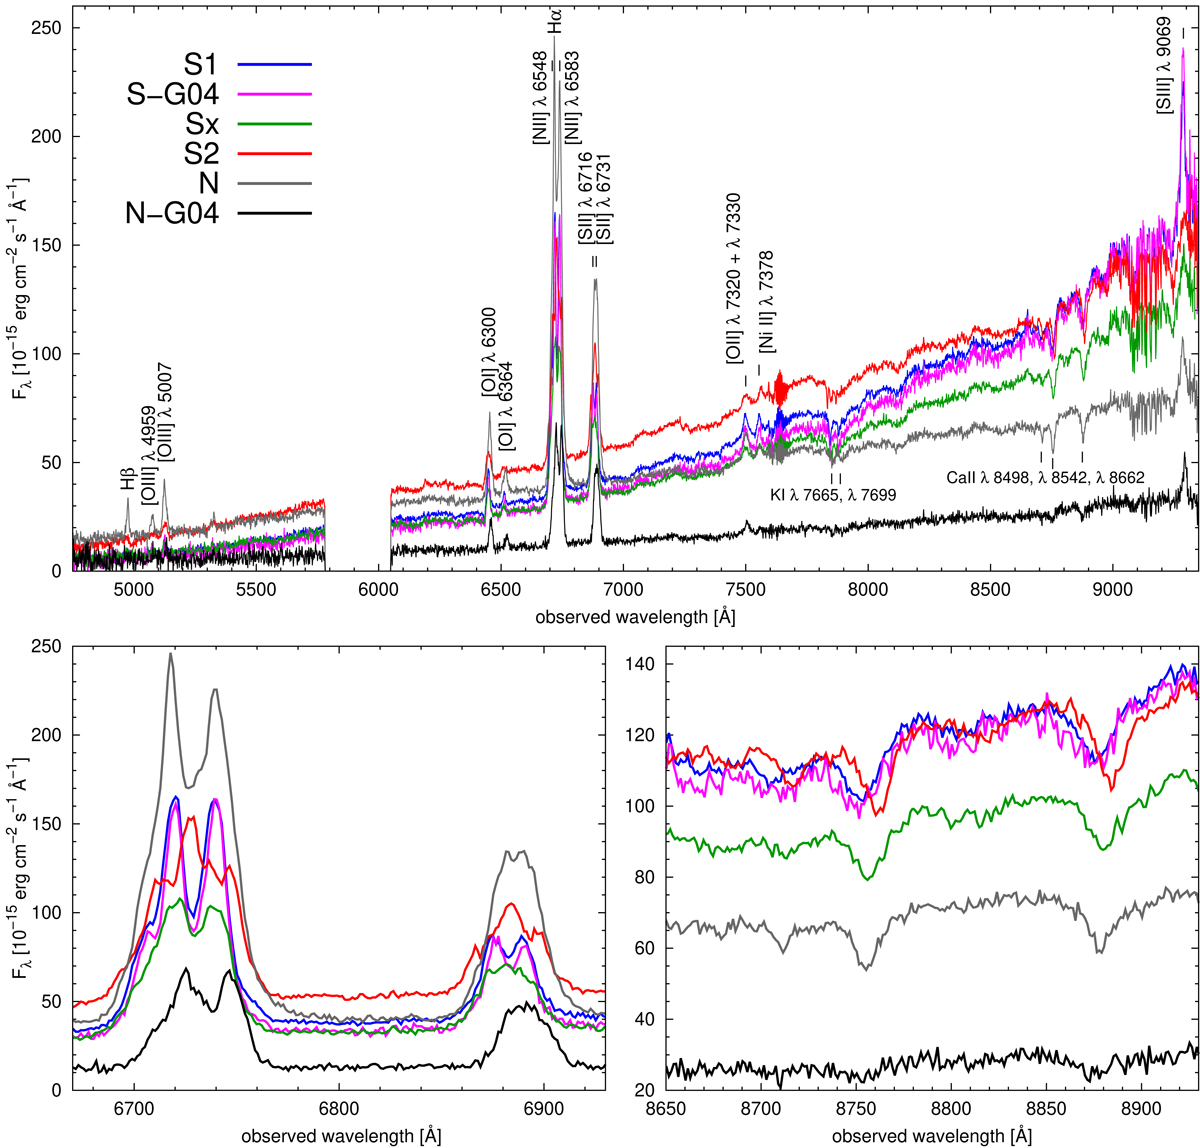
Spectra of the northern N (gray) and southern S1 (blue) and S2 (red) emission regions, of the northern N-G04 (black) and southern S-G04 (pink) MERLIN and VLBA radio positions, and the region Sx between the southern components (green). In the lower panels are shown enlargements of the Hα/[SII] complex and of the near-infrared CaII triplet lines.
Current usage metrics show cumulative count of Article Views (full-text article views including HTML views, PDF and ePub downloads, according to the available data) and Abstracts Views on Vision4Press platform.
Data correspond to usage on the plateform after 2015. The current usage metrics is available 48-96 hours after online publication and is updated daily on week days.
Initial download of the metrics may take a while.