Free Access
Fig. 5.
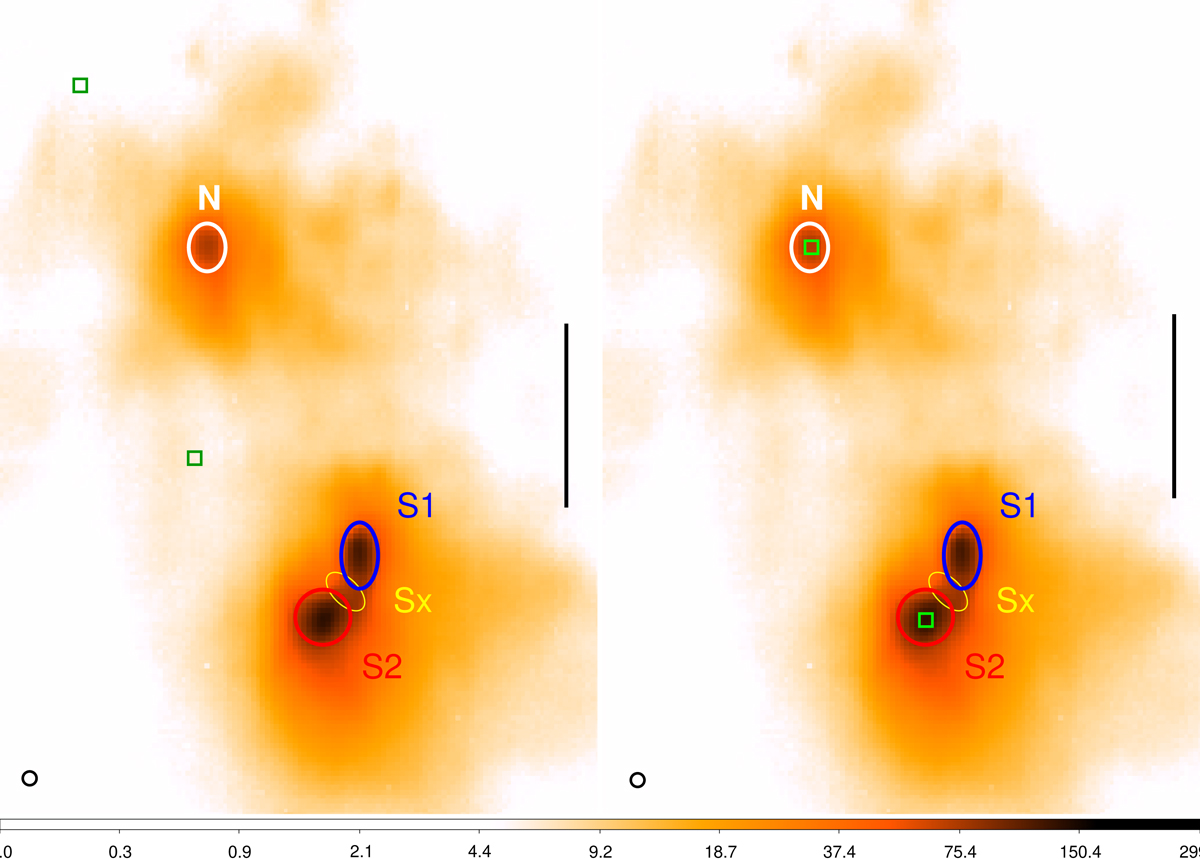
Positions of Gaia sources (green squares) and MUSE sources before (left) and after (right) absolute calibration of the MUSE data. The black line is 1 arcsec long. An inverse log scaling was used for the color map.
Current usage metrics show cumulative count of Article Views (full-text article views including HTML views, PDF and ePub downloads, according to the available data) and Abstracts Views on Vision4Press platform.
Data correspond to usage on the plateform after 2015. The current usage metrics is available 48-96 hours after online publication and is updated daily on week days.
Initial download of the metrics may take a while.