Fig. 3.
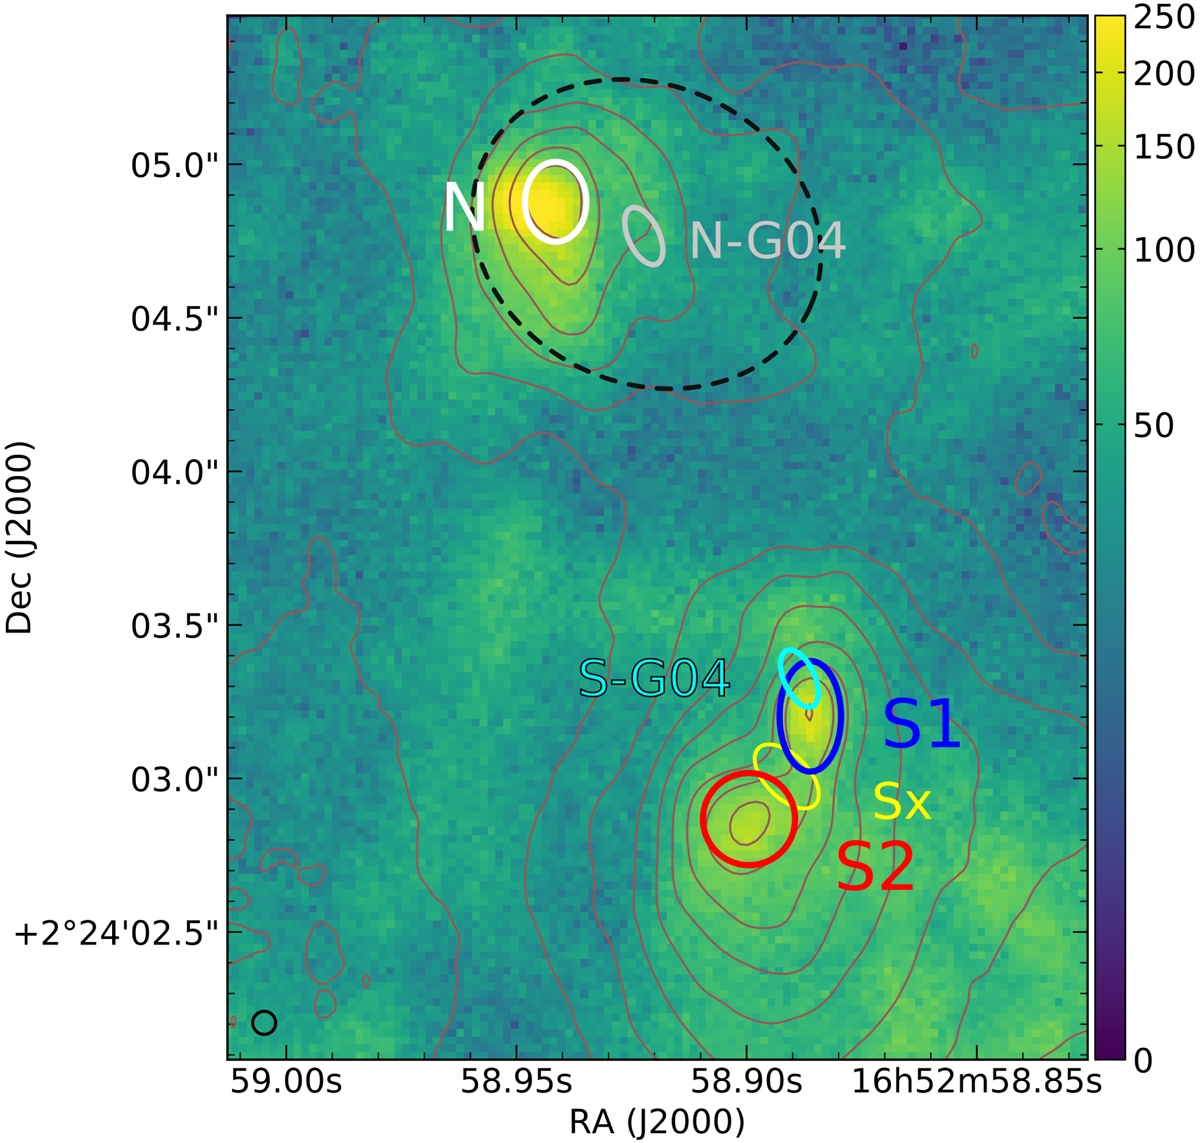
Hα/[NII] image of the zoomed-in white square in Fig. 1. Again, I-band contour levels are overlaid. Spectra were extracted at the three locations corresponding to the peaks of maximum intensity in the I-band map (N, S1, S2, indicated by circles or ellipses). Also indicated are the positions of the two MERLIN and VLBA radio sources N-G04 and S-G04 (Gallimore & Beswick 2004). The flux is given in units of 10−20 erg cm−2 s−1 pix−1.
Current usage metrics show cumulative count of Article Views (full-text article views including HTML views, PDF and ePub downloads, according to the available data) and Abstracts Views on Vision4Press platform.
Data correspond to usage on the plateform after 2015. The current usage metrics is available 48-96 hours after online publication and is updated daily on week days.
Initial download of the metrics may take a while.