Fig. 11.
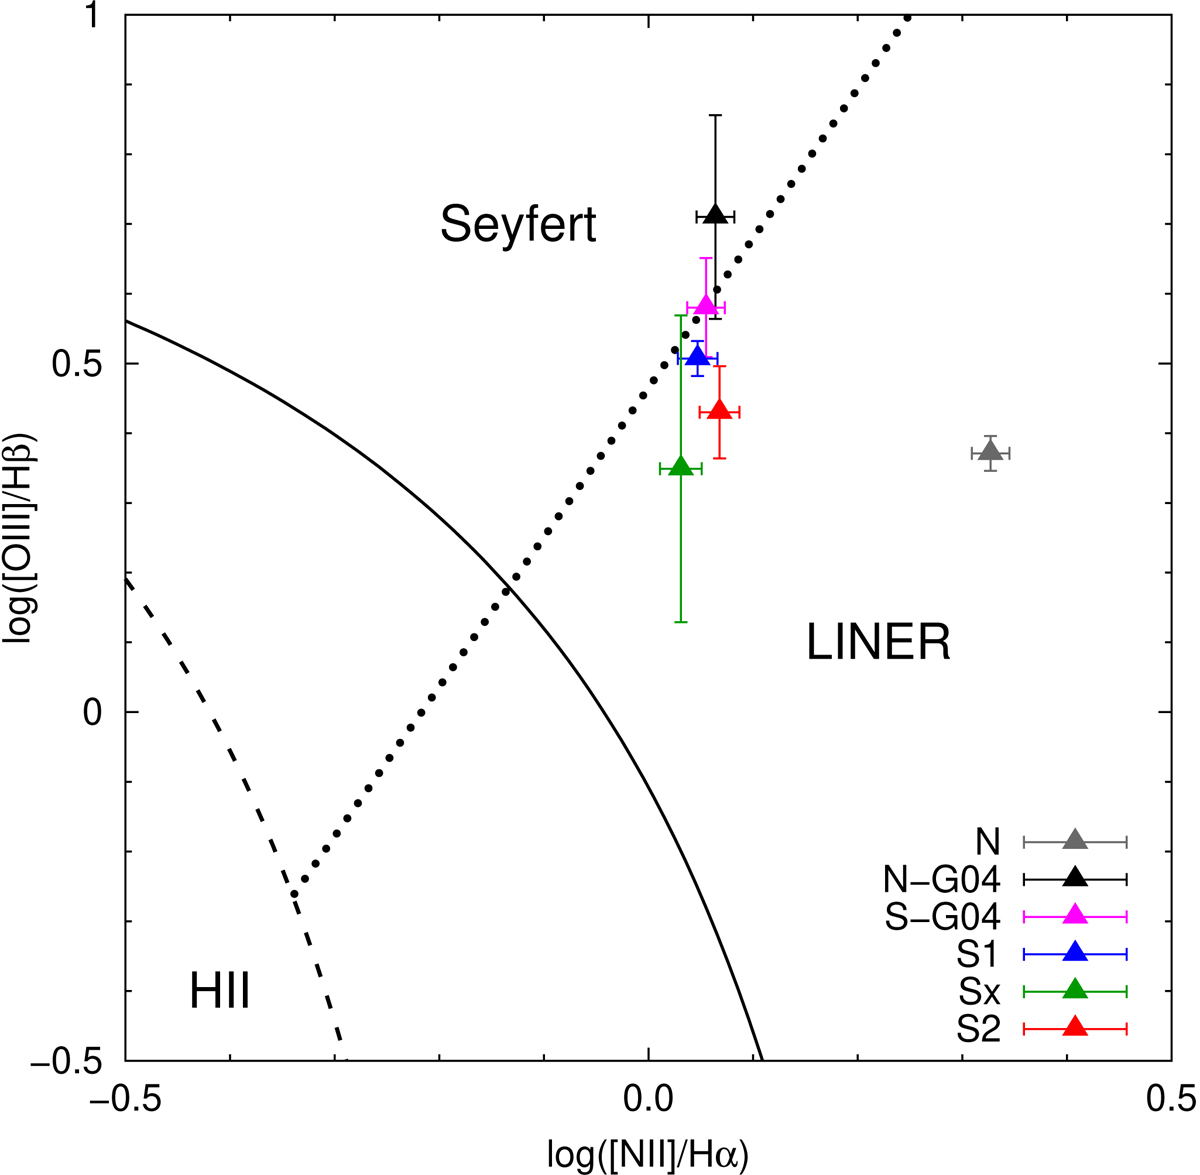
Diagnostic BPT diagram of [OIII]5007/Hβ vs. [NII]6584/Hα for individual emission line regions in NGC 6240. The dashed lines and solid lines are the dividing lines between AGN (upper right) and HII-region galaxies (lower left) (Kauffmann et al. 2003; Kewley et al. 2006). The dotted line is the dividing line between Seyfert and LINER nuclei.
Current usage metrics show cumulative count of Article Views (full-text article views including HTML views, PDF and ePub downloads, according to the available data) and Abstracts Views on Vision4Press platform.
Data correspond to usage on the plateform after 2015. The current usage metrics is available 48-96 hours after online publication and is updated daily on week days.
Initial download of the metrics may take a while.