Fig. 5
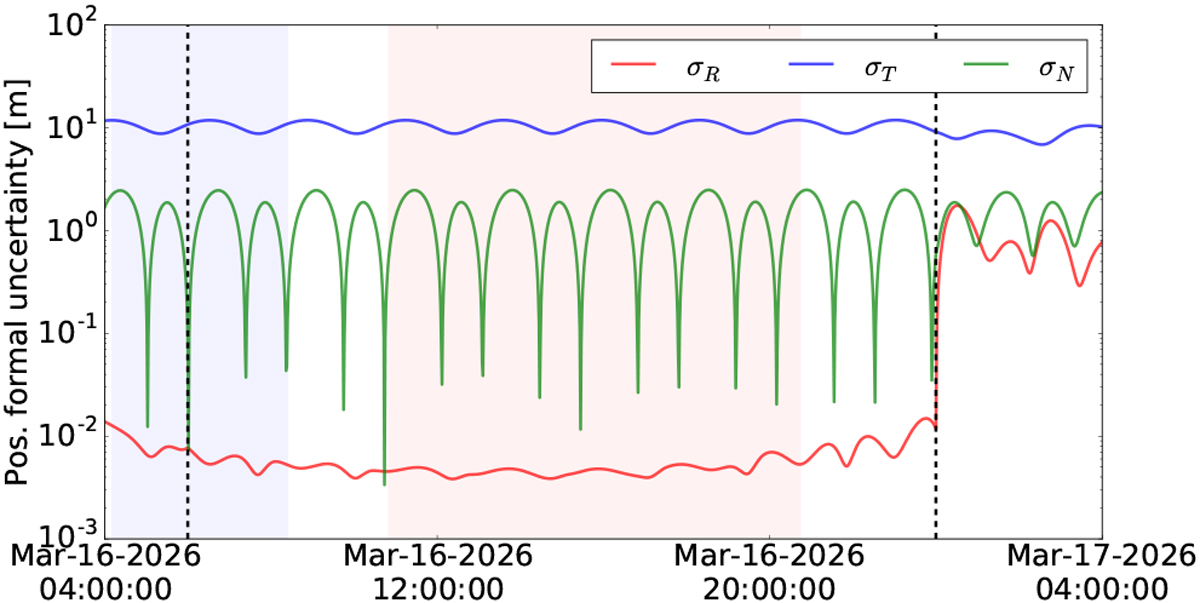
Propagated formal standard deviations of position as a function of time for a typical one-day arc. Quantities σR, σN, and σT indicate theradial component, the component normal to the spacecraft orbital plane, and the transversal component, respectively.The light blue and light red zones depict the X-band (navigation) and Ka-band (scientific) tracking periods, respectively.The black dashed lines indicate the two reaction wheels desaturation maneuvers present on each arc.
Current usage metrics show cumulative count of Article Views (full-text article views including HTML views, PDF and ePub downloads, according to the available data) and Abstracts Views on Vision4Press platform.
Data correspond to usage on the plateform after 2015. The current usage metrics is available 48-96 hours after online publication and is updated daily on week days.
Initial download of the metrics may take a while.