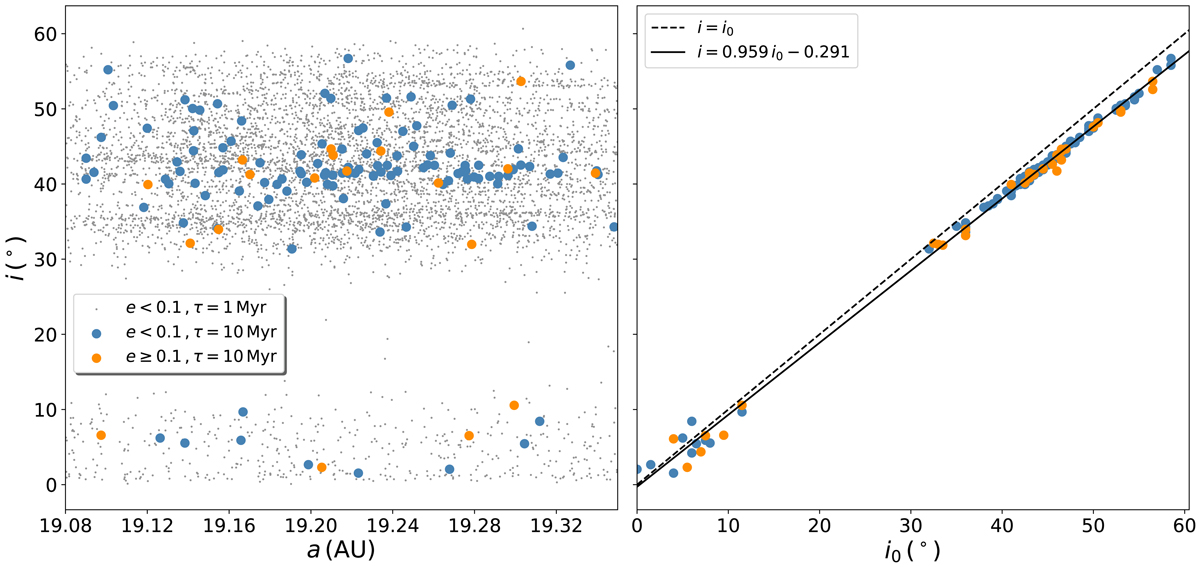
Fig. 10.

Final distributions of orbits that never left the 1:1 MMR region of Uranus during planetary migration. Left and right panels: final inclination i against the final semi-major axis a and initial inclination i0, respectively. The black dots indicate the orbits surviving fast migration with the final eccentricity e lower than 0.1; the other dots indicate the orbits surviving slow migration, of which the blue and orange points represent those with e < 0.1 and e ≥ 0.1, respectively. The dashed line in the right panel depicts the equality of i and i0; the solid line depicts the best fit for slow migration. For a clear comparison with the stability regions (see Figs. 1 and 8), the same range in semi-major axis is shown in the left panel at the cost of abandoning a small part of orbits. In the right panel only data for slow migration is shown for better visibility.
Current usage metrics show cumulative count of Article Views (full-text article views including HTML views, PDF and ePub downloads, according to the available data) and Abstracts Views on Vision4Press platform.
Data correspond to usage on the plateform after 2015. The current usage metrics is available 48-96 hours after online publication and is updated daily on week days.
Initial download of the metrics may take a while.


