Fig. 7.
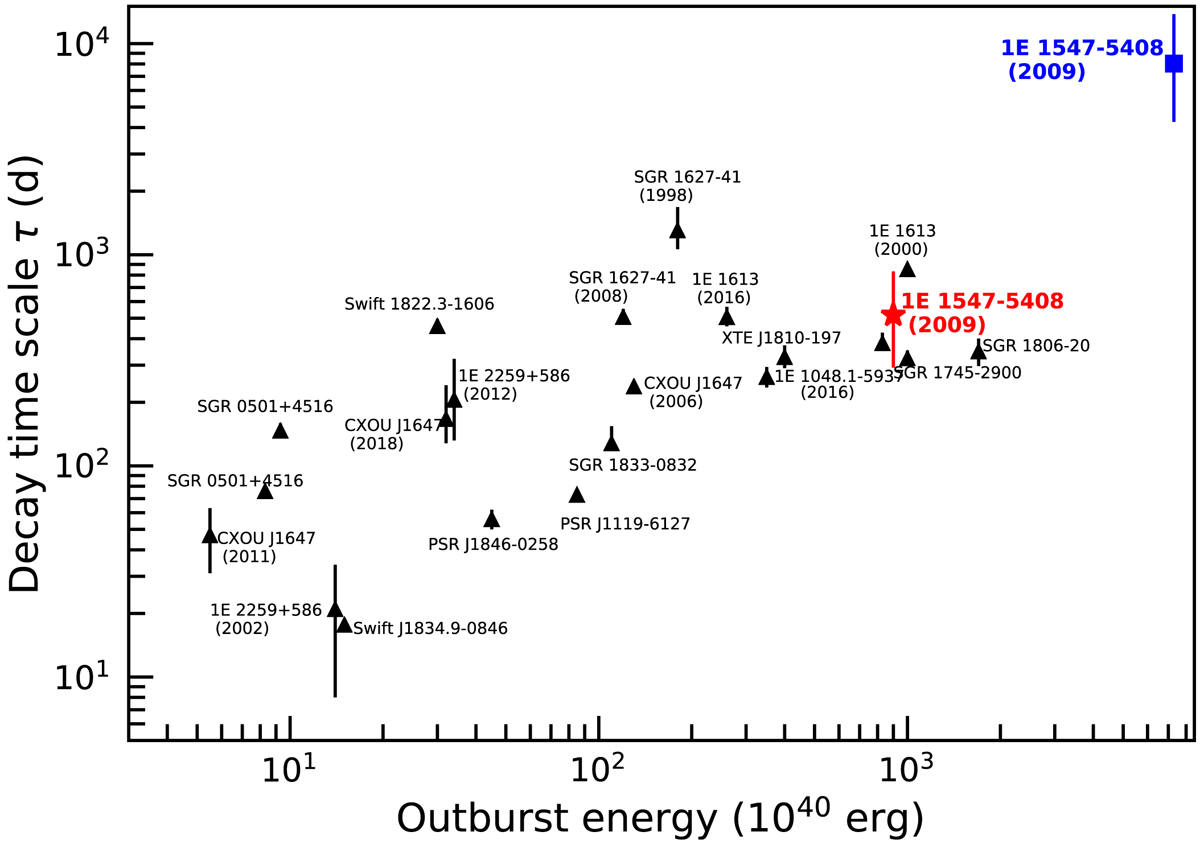
Decay timescale (in terms of the e-folding time τ) as a function of the total energy released for all magnetar outbursts detected so far. For the cases where more exponential functions were adopted to model the light curve, the value of τ corresponding to the exponential function modeling the late-time evolution of the outburst was considered. The blue square refers to the case where 1E 1547.0–5408 is assumed to return to the 2006 level. The red star refers instead to the case where 1E 1547.0–5408 is assumed to have settled on a new persistent state over the last years. In a few cases, the size of the marker is larger than the error bars. Adapted from Borghese et al. (2019).
Current usage metrics show cumulative count of Article Views (full-text article views including HTML views, PDF and ePub downloads, according to the available data) and Abstracts Views on Vision4Press platform.
Data correspond to usage on the plateform after 2015. The current usage metrics is available 48-96 hours after online publication and is updated daily on week days.
Initial download of the metrics may take a while.