Fig. 6.
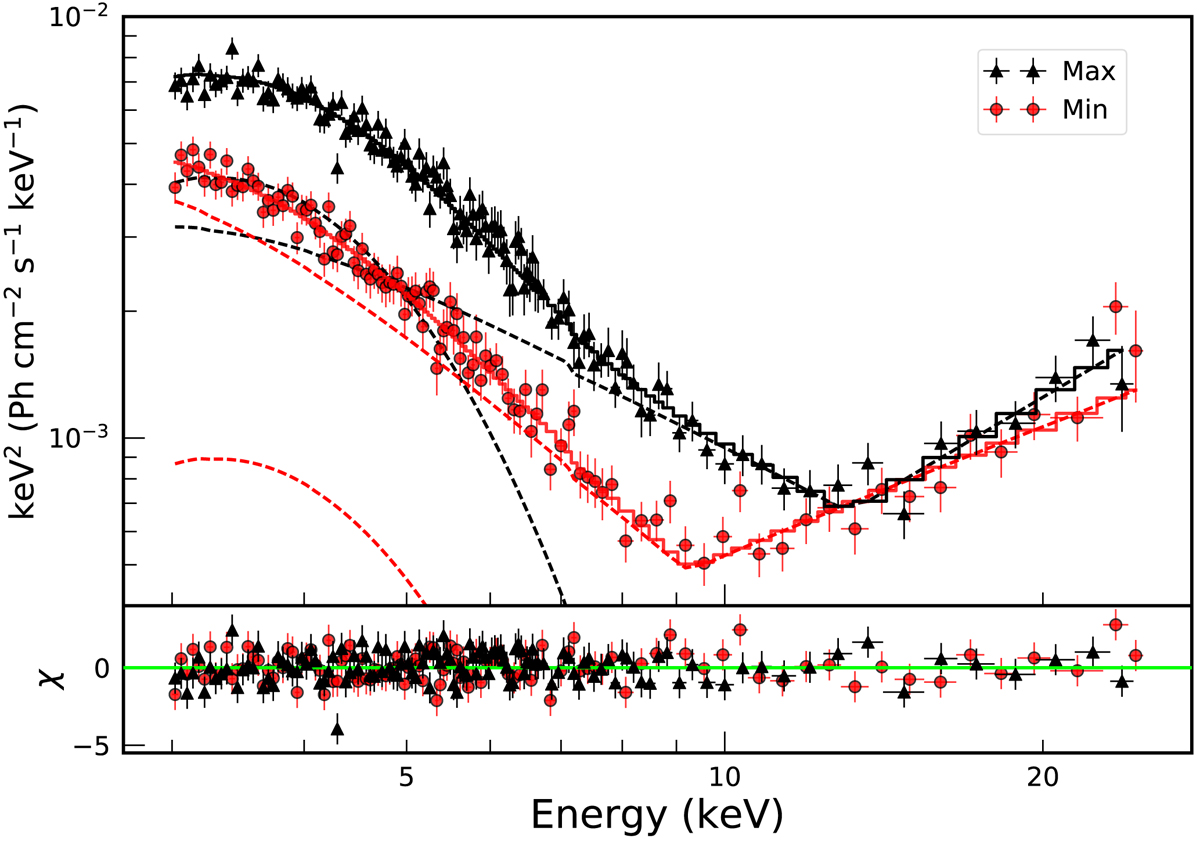
Top: E2f(E) unfolded spectra of 1E 1547.0–5408 extracted from the merged NuSTAR data sets at the maximum (in black) and at the minimum (in red) of the pulse profile. Data points were re-binned for plotting purpose. The solid lines represent the best-fitting BB+2PL model. Dashed lines mark the contribution of the single components to the spectral model. Bottom: post-fit residuals in units of standard deviations.
Current usage metrics show cumulative count of Article Views (full-text article views including HTML views, PDF and ePub downloads, according to the available data) and Abstracts Views on Vision4Press platform.
Data correspond to usage on the plateform after 2015. The current usage metrics is available 48-96 hours after online publication and is updated daily on week days.
Initial download of the metrics may take a while.